
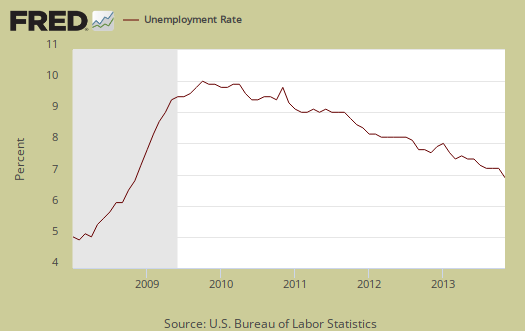
Welcome to the wild weird current population survey unemployment report where dramatic monthly swings cause paranoia and doubt. We shed light on these woolly figures and this month there is much to flash that light on. First, the unemployment rate dropped 0.3 percentage points to 7.0%. This is the lowest unemployment rate since November 2008. Yet, this month's unemployment rate drop might be artificial. At first glance, the labor participation rate increased by 0.2 percentage points, yet as a trend, the labor participation rate is way too low. There were 818,000 more people reported as employed in November, a huge jump, but some of the reasons for these wild swings are the Federal workers returning from the government shutdown.
This article overviews and graphs the statistics from the Employment report Household Survey and while November is yet another funky month, contained within this report might be finally some positive signs labor market conditions are improving. First, part of the reason the unemployed declined is due to 377,000 Federal workers no longer counted as unemployed due to being temporarily laid off. Second, the Household survey changed the reference week from the one which includes the 12th of the month, to the week which includes the 5th of the month. While this seems trivial to move a survey up a week, it could very well be why we see more wild swings in the data. So our usual warning of don't rely on monthly changes and look at the trend applies even more so for this month.
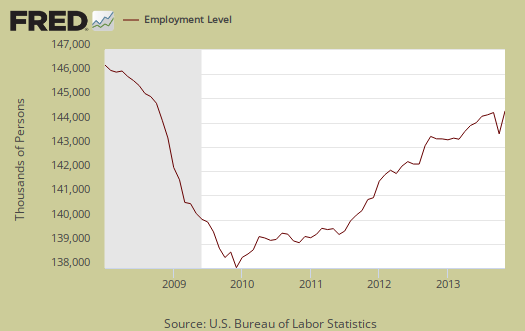
Below is a graph of the household survey employed and we can see this is the largest monthly change in employed persons since March 2009, ignoring benchmarks added to the month of January. That said, if we take October and November together we get a 93,000 gain in employed persons, which is probably the truth of the real gain in employed as the shutdown clearly threw a monkey wrench into the monthly figures. The cause of the massive increase is not new entrants to the ranks of the employed as those figures dropped by -58,000 for the month.
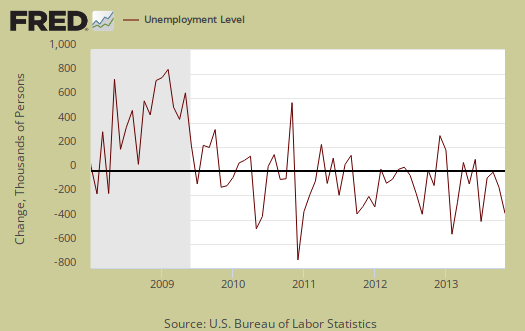
Those unemployed stands at 10,907,000, a -365,000 drop from last month and a main reason why the unemployment rate declined by 0.3 percentage points in a month. Below is the change in unemployed and as we can see, this number normally swings wildly on a month to month basis generally. Temporary unemployment of Federal workers clearly went into the unemployment levels for October and so be very careful to look at the trend line below for the past year.
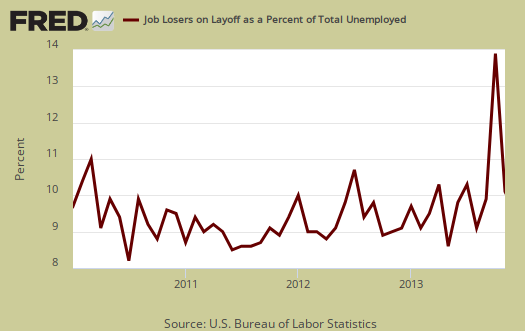
Below is a graph of temporary layoffs as a percentage of the total unemployed. What we should get out of this graph is the shutdown really threw off true unemployment statistics and we might even have to wait a couple more months to get validation that the unemployment situation is slowly improving.
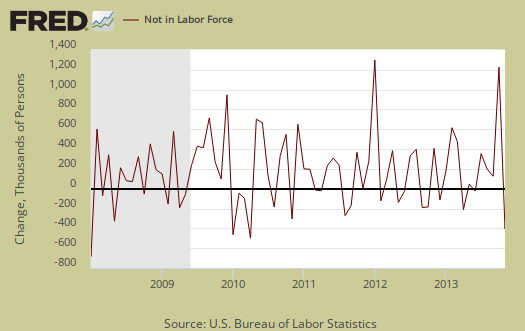
Those not in the labor force declined by -268,000 persons, but did not wipe out last month's massive increase of almost a million added to not in the labor force. The below graph is the monthly change of the not in the labor force ranks. This is actually not great news to see people dropping out of the labor force staying there, although this figure might be off due to the reference week change.
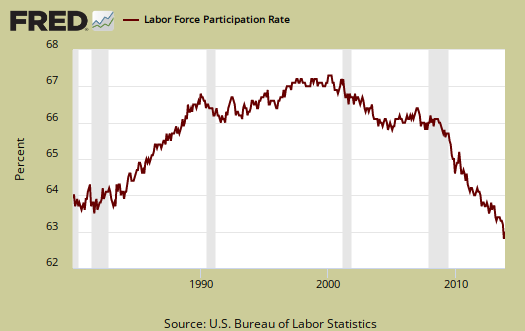
The most frightening statistic of the household survey is the labor participation rate. The labor participation rate increased by 0.2 percentage points to 63%. While this is an improvement from last month's record low, the labor participation rate is still down 0.6 percentage points from a year ago. This implies that those who were dropped from the labor force are staying out of the labor force in large numbers. For those claiming the low labor participation rate is just people retired, we proved that false by analyzing labor participation rates by age. In other words, the dramatic increase of those not in the labor force cannot be everyone retiring who is age 55 and over.
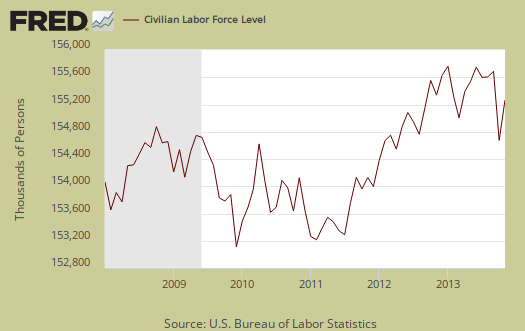
The civilian labor force, which consists of the employed and the officially unemployed, dramatically increased by 455 thousand in a month. The dramatic rise must be variance, as the civilian labor force dropped in October by -720,000. We've seen wild swings in the civilian labor force figure previously and we believe this has to do with the normal variance in month to month figures as well as the change in the reference week and shutdown. Bottom line, once again, look at the trend over a year or two for validity of the size of the labor force.
In spite of the wild swings, as a slope, or rate of increase, those not in the labor force grows faster than the population that has the potential to work. Below is a graph of those not in the labor force, (maroon, scale on the left), against the noninstitutional civilian population (blue, scale on the right). Notice how those not in the labor force crosses the noninstitutional civilian population in growth and the accelerated growth started happening right in 2008. This cannot possibly be retirees, all at once, in spite of the baby boom, there simply were not that many babies born in 1943 to explain the step increase starting with the recession.

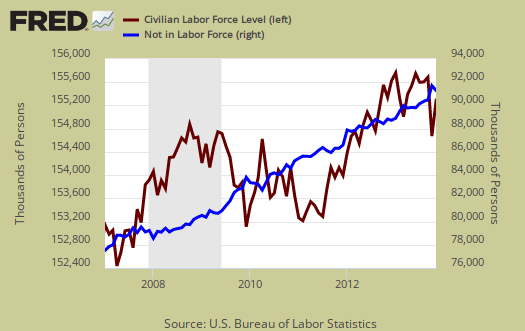
Below is a graph of the civilian labor force, or the official employed plus unemployed, in maroon, scale on left, against those not in the labor force, in blue, scale on right. Notice how those not in the labor force as a trend exceeded those considered employed and unemployed starting around mid 2009. It is only recently, in the past few months, where we see the reverse by trend lines, where the slopes implying growth rates are more matching. What we have seen is a never ending growing segment of the population that is considered neither employed or unemployed, i.e. not in the labor force, increasing, above the trend line of those who would be naturally dropping out, such as the retired and those in school. Not in the labor force figures do include retirees.
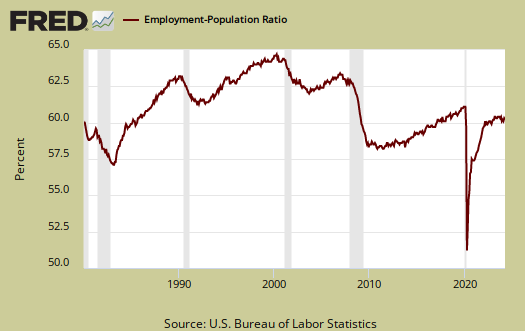
Those considered employed as a ratio to the total Civilian noninstitutional population recovered last month's plunge and is now the same rate as September 58.6%. This tells us again the shutdown really skewed the Household survey. Generally speaking the employment to population ratio has been hovering around 1983 record lows for years now and in 1983 there were more families with a stay at home mom, with wages high enough for only one adult to work and support a family. The low ratio implies there are many people who could be part of the labor force are not anymore, as shown in the graph below.
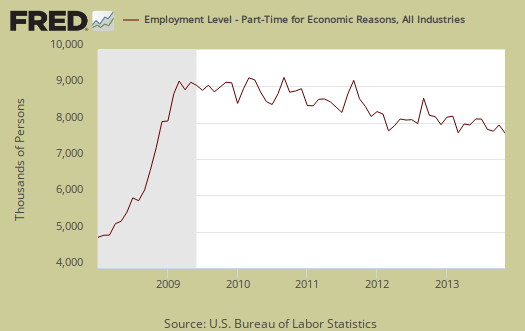
There are millions of people who need full-time jobs with benefits who can't get decent career oriented positions. Those forced into part time work is now 7,719,000, an dramatic decrease of -331,000 from last month. Those stuck in part-time has declined by -419 thousand from a year ago, which means this month's drop accounts for most of the annual decline. The below graph shows levels of people who could only get part time hours have remained elevated since the recession. If these figures stick and are a trend, this would be a very positive sign something was finally moving in the labor market.
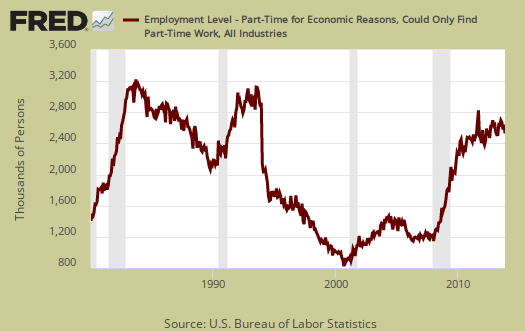
There are two categories of those working part-time hours. Those who could only get part-time jobs and those working who got their hours cut due to businesses not having enough work for them. The number of people who could only get part-time work decreased by -113 thousand to 2,486,000 and is also pretty much all of the annual drop. The number of people who could only find part-time work is shown in the below graph.
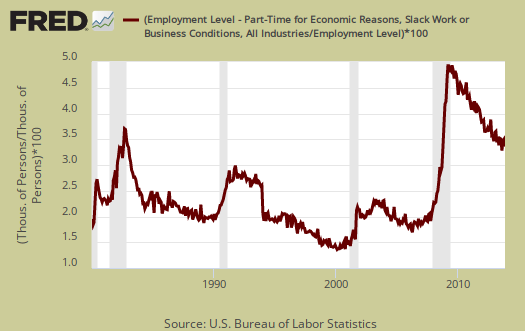
People can also be stuck with part-time hours due to slack working conditions. This figure has remained just obscenely high for years now yet this month dropped by -178,000 Below is a graph of forced into part-time work because they got their hours cut, as a percentage of the total employed. Part-time work due to cut hours is known as slack work conditions. Slack working conditions causing part-time hours remaining high or increasing implies economic conditions have not improved enough, that there still is just not enough demand in the economy for businesses to run full steam. Below is a graph of forced part-timers due to slack work conditions as a percentage of the civilian labor force. This is a recession economic indicator, notice the line slope matches strongly the gray recession bars of the graph.
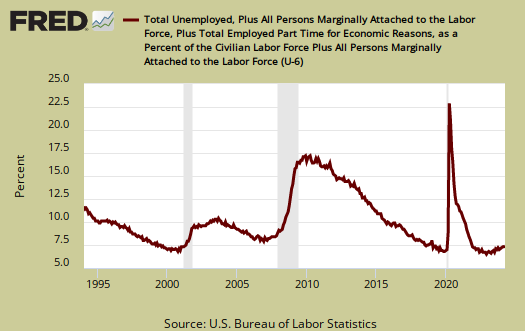
U-6 is a broader measure of unemployment and includes the official unemployed, people working part-time hours because that's all they can get and a subgroup not counted in the labor force but are available for work and looked in the last 12 months . The U-6 alternative unemployment rate still leaves out some people wanting a job who are not considered part of the labor force. U-6 plunged by 0.6 percentage points to 13.2% due to the drop in the official unemployment rate which is a part of U-6.
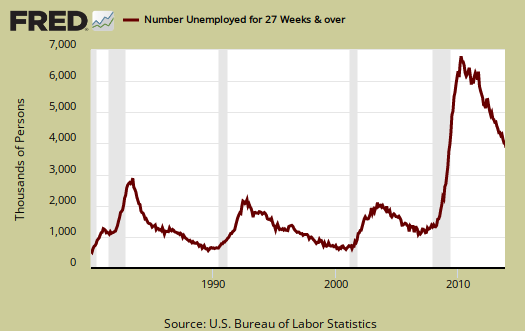
The long term unemployed, or those unemployed for 27 weeks and over, didn't really budge and stands at 4,066,000 people. The long term unemployed are the crisis of our time and extended unemployment benefits are out to run out if not renewed for 2014. If we see the long term unemployed actually get jobs, that is when we know the labor market is returning to health.
The marginally attached are people not in the labor force because they have not looked for a job in the last month, but have looked for a job in the last year. This number has ballooned since 2007 and not returned to pre-recession levels. The graph below is the number of people considered marginally attached to the labor force, currently at 2,096 million. The marginally attached should only be viewed as a long term trend for the figures are also not seasonally adjusted.
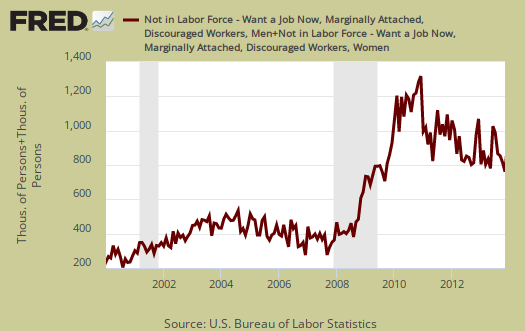
Discouraged workers are people, not counted as part of the civilian labor force, who not only want a job, but also looked for one in the last year. These people aren't job hunting now because they believe there are no jobs out there. Below is the graph of discouraged workers, currently at 762,000 people and are a subset of the marginally attached. Discouraged workers is kind of a barometer for how the job market is perceived, although with the other figures even with the 22% annual drop in discouraged workers from a year ago, we're not so sure this means things are strongly improving. Mildly improving yes, strongly, we don't think so.
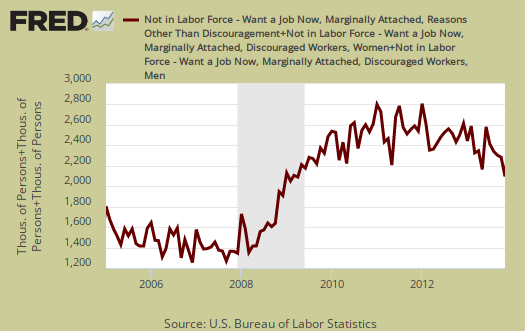
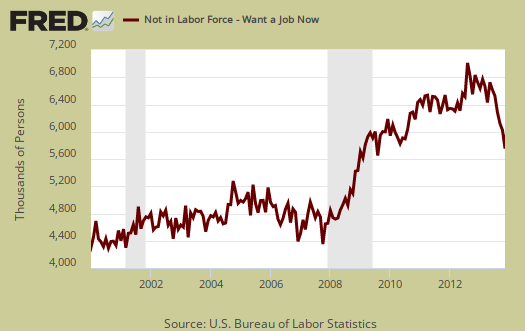
Our favorite statistic from the CPS survey is how many people who are considered not in the labor force, report they want a job now. It is a direct survey question from the CPS. The survey asks people who are not being counted in the unemployment statistics and official unemployment rate if they want a job. The number who answer yes currently stands at 5,754,000. This is a dramatic drop from last month of 408,000 and might very well explain the massive increase in those employed. We can only hope this is true and remains a trend for that would imply the labor market really is picking up. This figure includes the discouraged workers and marginally attached and is seasonally adjusted.
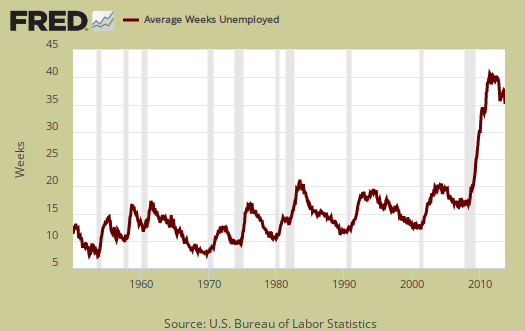
The average length of unemployment is now 37.2 weeks and this is really weird in that it increased while those short term unemployed dropped so dramatically as shown above. The average duration is so high due to the long-term unemployed who represent 37.3% of the unemployed. Many long term unemployed face age discrimination as well as discrimination for the fact they need a job, one of the worst injustices in America.
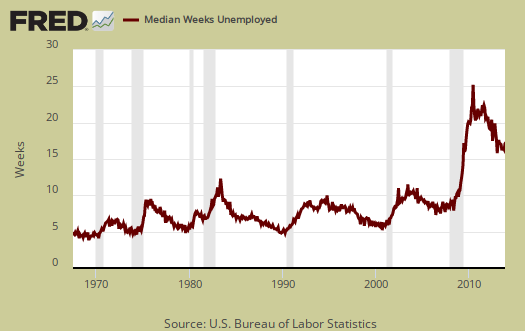
The median time one is unemployed, which means 50% of people have gotten a job in this amount of time, and is 17 weeks and increased by 0.7 percentage points, why we do not know except survey variance as many of these questions are individual household survey queries. This is over four months to be without a paycheck as the median, it's quite high.
Those unemployed less than five weeks saw a huge decline, -300 thousand from last month. Those unemployed between five weeks and 14 weeks decreased by -59 thousand and people who had been unemployed for 14 weeks to 26 weeks declined by -16,000. As previously noted, the long term unemployed increased by three thousand. . A drop in the unemployed does not necessarily mean they found a job.
Another crazy figure from this month's household survey is the reason for new unemployment status. Job losers and those who completely temporary jobs came back barreling down by -449,000 to 6,253,000. Needless to say this is clearly a monthly anomaly, due to the government shutdown temporarily throwing Federal workers under the employment bus.
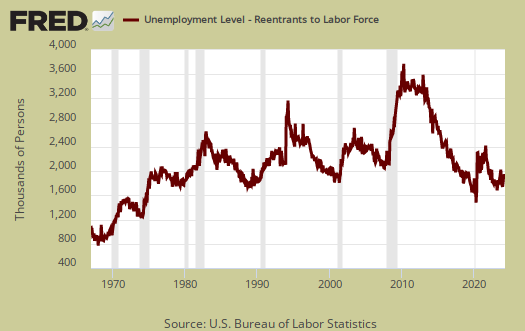
People join the ranks of the unemployed because they were laid-off, fired, they quit, the job was temporary and thus ended, they entered the labor force for the first time and re-entrants. Re-entrants are people with work experience, yet have been considered not in the labor force for some time. Recall to be considered unemployed one has to be actively searching for a job or expecting to be recalled and on temporary layoff. Re-entrants decreased by -44 thousand people this month. Below are re-entrants as a percentage of the total unemployed. As you can see, as jobs and opportunities appear, people re-enter the labor force looking to snap one of those jobs. Considering the massive damage still to the U.S. job market, the below tells us things really have not improved enough. If there were really a lot of job opportunities out there, the slope of this graph would spike up and should spike up to the extremes since there are so many who have stopped looking, are not counted as unemployed currently, who could re-enter the labor market.
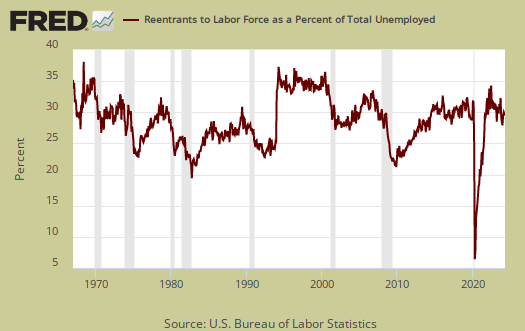
If one looks at the levels of re-entrants, or people considered not in the labor force who started actively looking for a job again, the levels are at all time highs in spite of the annual decline. This is yet another sign on how people are not finding work, giving up, then dropping out of the labor force and then trying again to get a job. If the job market was good for a long period we'd see this statistic finally drop as new entrants would have found work instead of being once again officially counted as unemployed.
To sum up this month's household survey, it's all still pretty crazy wild. That said when looking at trend lines we get a sense the situation is improving, but way too slowly still. There is some evidence things are starting to pick up, although it is still too early in the statistics to make that claim absolutely.
Here is our past overviews CPS unemployment statistics.
Recent comments