
The July Consumer Price Index increased 0.5% from last month and half of it is gas, which increased 4.7% in a month. Core CPI, or price increases minus food and energy costs, rose 0.2%. Core CPI is a Federal Reserve inflation watch number. For the year, not seasonally adjusted, the Consumer Price Index for all Urban Consumers (CPI-U) has risen 3.6%. In May CPI dropped by -0.2%.
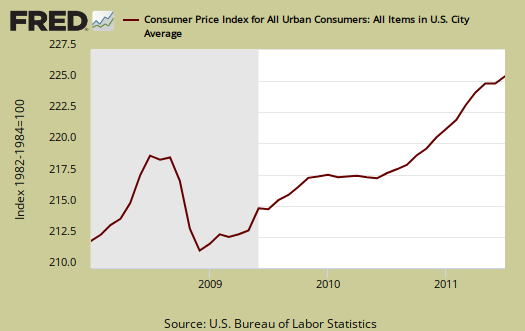
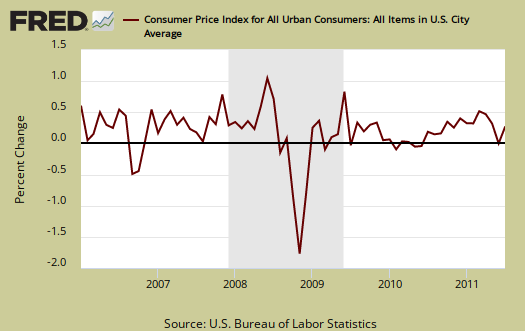
Below is the monthly percentage change in CPI-U, all items. U stands for Urban consumers.
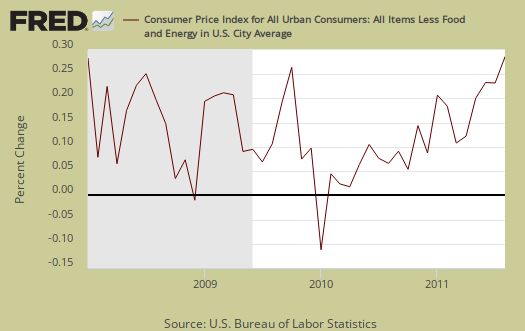
Core CPI, or all items less food and energy, increase is 1 percentage point lower than last month. Shelter is up 0.3%, the largest increase since June 2008, medical care increased 0.2%, clothing up 1.2%, used autos increased 0.7% and hotels, motels increased 0.9%. The increases are pretty much across the board except home heating oil, which dropped slightly but is up 29% for the year, not seasonally adjusted.
Core CPI's monthly percentage change is graphed below. As we can see, overall, without energy and food, inflation for the third time is showing up.
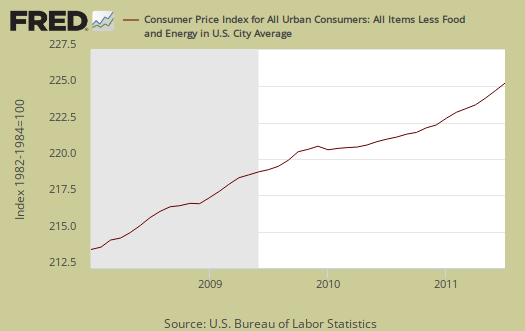
Below is the St. Louis FRED graph to show the overall index on core CPI, or CPI without food and energy included. We are seeing an acceleration uptick in core although the recession, which includes the 2008 portion of the graph was deflationary.
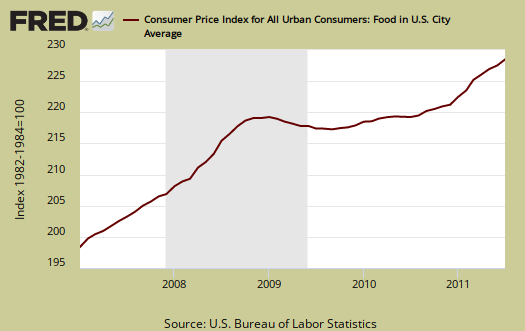
Food and beverages as well as groceries increased, 0.4% in July and the food index is up 4.2% for the year. Food at home, or groceries, increased 0.6%. The graph below is food, which includes food at home and restaurants. From the BLS:
Over the past 12 months, the food index has risen 4.2% with the food at home index up 5.4%. All major grocery store food group indexes have risen over the past year; the increases ranged from 3.5% (other food at home) to 7.9% (dairy and related products).
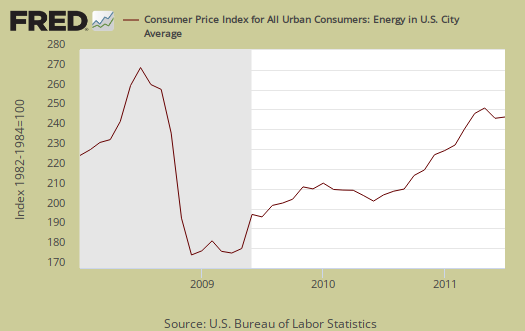
Energy overall increased 2.8% for the month is a whopping 19.0% increase for the year. Below is the CPI-U Energy Index.
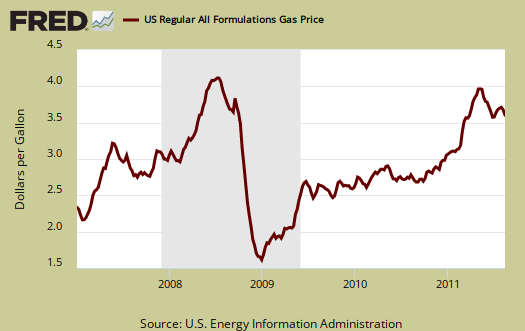
Below are gas prices, last updated August 15th. Despite this month's plunge on the gas index, it's still up 33.6% for the year. Notice the oil bubble in early 2008 and notice how close gas prices are now to that previous oil bubble. Bear in mind this report is for July.
The CPI energy index, capturing the last oil bubble below, is all energy, gas, natural gas, fuel oil and so on. Notice it's dip and return versus the food index as well as how it's not as high as the CPI energy index was during the oil commodities bubble of 2008.

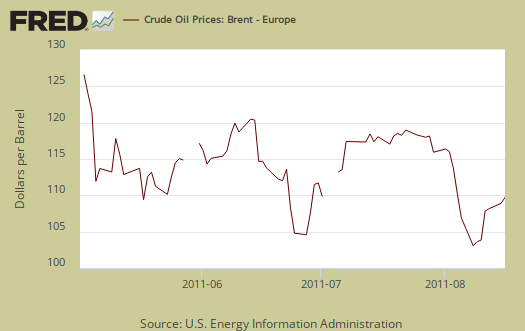
For a reality check below is Brent Crude Oil. It looks positive that gas prices will decline in August.
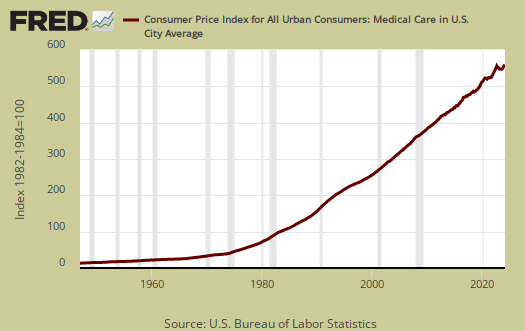
The Medical index increased 0.2% for the month and Medical care increased 0.2%, with services increasing 0.3%. Medical commodities are things like your prescription drugs and it didn't increase from last month. Strange isn't it, that Medical care is never mentioned when referring to costs and inflation. It's only as important as food, yet health care is treated almost like it's an extra for daily living.
There has been much criticism as of late that the Federal Reserve only focuses in on core CPI, instead of food and energy. According to the BLS, Food and beverages, which includes food at home, makes up 14.8% of the index. Housing is 41.5% and transportation, including gas for the car, is 17.3%. Medical care is only 6.6%, which frankly, we hope to examine later as not being a reality percentage. All items minus food and energy are considered 77.2% of the total price expenditures for consumers.....according to them.
Regardless, this increase in core CPI will probably get the Fed's attention.
The DOL/BLS does take yearly surveys on where the money goes in the monthly budget, but as one can see, food and energy are significant amounts of the monthly finances. Run away costs in these two areas can break the bank. Considering we have price deflation in housing due to the real estate sector bubble pop, it's strange for food and energy consumer prices to be dismissed when crafting monetary policy, dismissed as volatile. A year of data to me, isn't volatile enough to dismiss, especially when these are key critical needs for regular people.
CPI-W for the month, unadjusted was 222.686 , a +0.1% increase from last month and a 4.1% increase for the year. CPI-W is used to calculate government transfer payments, such as social security increases.
Note the the chained CPI-U also increased 0.1%, 3.5% for the year and this is not seasonally adjusted. Chained CPI is in 2005 dollar values, which has a flattening effect on real inflation, thus flatting cost of living adjustments if used.
This report is from the BLS website. These numbers are for CPI-U, whereas the metric used to calculated social security and other government payments is CPI-W.
Last month's CPI report overview, unrevised, although most graphs are updated, is here.
Recent comments