
The initial Q4 GDP estimate is an ominous 0.7%. Consumer spending was the only dimly lit bright spot,with changes in inventories removing 0.45 percentage points from GDP. The trade deficit didn't help either as exports were less than imports and the end result was a -0.47 percentage point drain on Q4 real GDP. Both government and fixed investment GDP contribution was next to nil.

As a reminder, GDP is made up of: where Y=GDP, C=Consumption, I=Investment, G=Government Spending, (X-M)=Net Exports, X=Exports, M=Imports*. GDP in this overview, unless explicitly stated otherwise, refers to real GDP. Real GDP is in chained 2009 dollars.
The below table shows the GDP component comparison in percentage point spread from Q3 to Q4.
| Comparison of Q3 2015 and Q4 2015 GDP Components | |||
|---|---|---|---|
|
Component |
Q3 2015 |
Q4 2015 |
Spread |
| GDP | +1.99 | +0.70 | -1.29 |
| C | +2.04 | +1.46 | -0.58 |
| I | -0.11 | -0.41 | -0.30 |
| G | +0.32 | +0.12 | -0.20 |
| X | +0.09 | -0.31 | -0.40 |
| M | -0.35 | –0.16 | +0.19 |
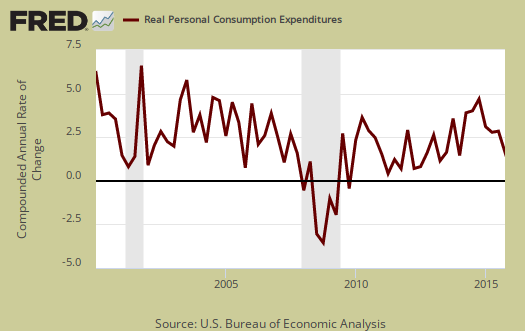
Consumer spending, C was the bright spot, yet that's not saying much. With a 1.46 percentage point increase, that is not as strong as Q3 or Q2. Below is a percentage change graph in real consumer spending going back to 2000.
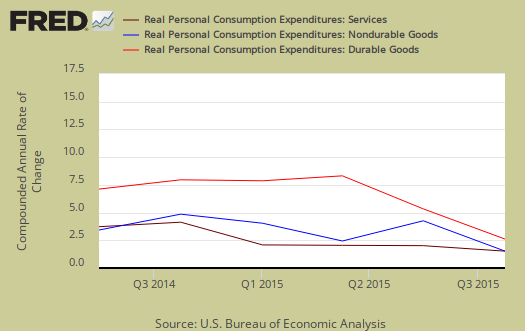
Goods contributed 0.53 percentage points to GDP and within goods, durables was 0.32 percentage points. Services was a 0.93 percentage point contribution. Within services, health care was a 0.43 percentage point contribution to Q4 GDP. Graphed below is PCE with the quarterly annualized percentage change breakdown of durable goods (red or bright red), nondurable goods (blue) versus services (maroon).
Imports and Exports, M & X show some imploding with a –0.47 percent point contribution. This is the advance GDP estimate, hence actual trade data hasn't come in yet and imports are almost always revised upward, even with petroleum imports declining as a trend.

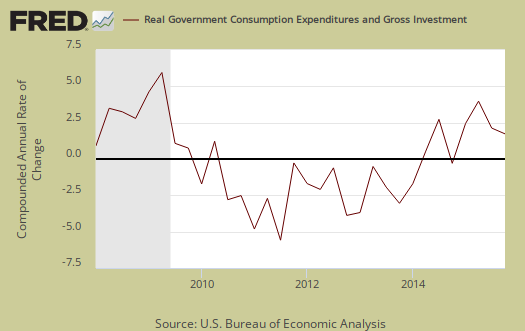
Government spending, G contributed 0.12 percentage points to Q4 GDP with0.14 percentage points contributed by national defense.
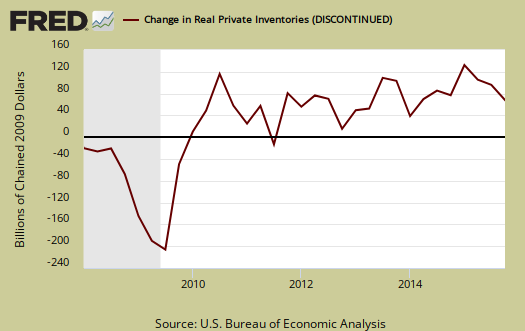
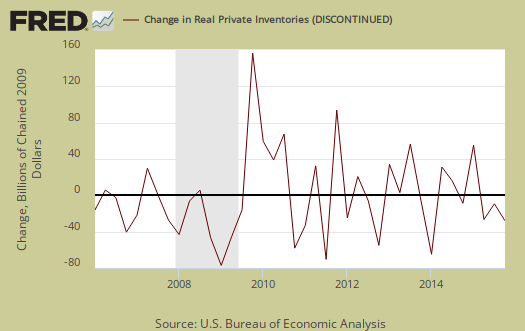
Investment, I is made up of fixed investment and changes to private inventories. The change in private inventories alone was a -0.45 percentage point contribution. Below are the change in real private inventories and the next graph is the change in that value from the previous quarter.
Fixed investment is residential and nonresidential and was just 0.03 percentage points of GDP contribution. Nonresidential was a -0.24 individual percentage point contribution. Within nonresidential, both structures and equipment were -0.15 GDP percentage points.

Residential fixed investment was 0.27 percentage points to GDP. The below graph shows residential fixed investment.

Nominal GDP: In current dollars, not adjusted for prices, of the U.S. output,was $18,128.2 billion, a 1.5% annualized increase for Q3 from Q4. In Q3, current dollar GDP increased 3.3%, showing Q4's growth was less than half of Q3.

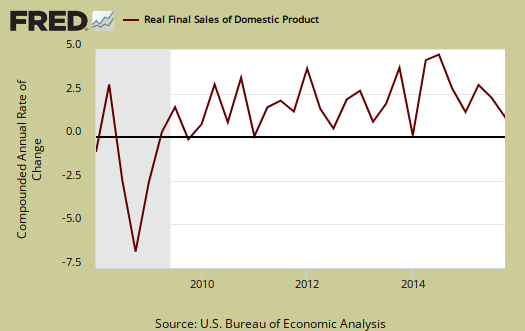
Real final sales of domestic product is GDP - inventories change. This figures gives a feel for real demand in the economy. This is because while private inventories represent economic activity, the stuff is sitting on the shelf, it's not demanded or sold. Real final sales increased 1.2%.
Gross domestic purchases are what U.S. consumers bought no matter whether it was made in Ohio or China. It's defined as GDP plus imports and minus exports or using our above equation: where P = Real gross domestic purchases. Real gross domestic purchases increased 1.1% in Q4. Exports are subtracted off because they are not available for purchase by Americans, but imports are available for purchase in the U.S. When gross domestic purchases exceed GDP, that's actually bad news, it means America is buying imports instead of goods made domestically.

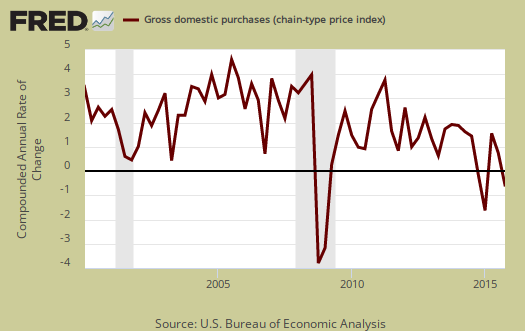
The price index for gross domestic purchases increased 0.2% for Q4. Without food and energy considered, the core price index increased 0.9%. In Q3 the price index was 1.3% for both the overall and without food and energy considered. That's quite below the Federal Reserve's target inflation rate, especially when taking gasoline prices out of the equation. Below is the price index for gross domestic purchases.
Below are the percentage changes of the Q4 2015 GDP components, from Q3. The thing to notice is how exports improved for Q2. There is a difference between percentage change and percentage point change. Point change adds up to the total GDP percentage change and is reported above. The below is the individual quarterly percentage change, against themselves, of each component which makes up overall GDP. Additionally these changes are seasonally adjusted and reported by the BEA in annualized format.
|
Q4 2015 GDP Component Percentage Change (annualized) |
|||
|---|---|---|---|
| Component | Percentage Change from Q3 | ||
| GDP | +0.7% | ||
| C | +2.2% | ||
| I | -2.5% | ||
| G | +0.7% | ||
| X | -2.5% | ||
| M | +1.1% | ||
This GDP report implies a continuing slowing economy. Contracting inventories for two quarters in a row is of particular concern and might imply businesses are not expecting a surge of new business. Most telling is how consumer spending growth is slowing. While the last employment report was strong, it is doubtful that will continue as jobs are correlated to real economic growth.
Other overviews on gross domestic product can be found here. The BEA GDP site is here.
first downward revision
the technical notes for this release said that BEA assumed an increase in nonresidential construction and an increase in residential construction in December...that report was released today and showed nonresidential spending fell 2.1%...
rjs
worse..
the November construction spending estimate was revised down from $1,122.5 billion to $1,116.0 billion annually
rjs
much worse
last week i reviewed factory inventories as compared to BEA estimates and judged that their level would have little impact of revisions to 4th quarter GDP...but in computing 4th quarter GDP, the BEA assumed an increase inventories in merchant wholesale and retail industries other than motor vehicles (pdf) for December at a $26.5 billion annual rate, which would work out to about $2.2 billion monthly...today's business inventory report shows retail inventories ex-autos up 0.2%, or a bit over $0.8 billion, whereas the wholesale inventories report showed total inventories down almost $0.8 billion despite a $168 million increase in automotive products inventories...so it appears that the BEA overestimated December and end of quarter wholesale and retail inventories by nearly $2.4 billion, which would work out to a decrease at $9.5 billion annual rate from previously published figures, which would in turn would result in a subtraction of roughly 0.58 percentage points from 4th quarter GDP...
rjs