
The GDP initial estimate reports a weak 1.9% economic growth for the 4th quarter. Imports really hammered GDP, just in time to validate now President Trump. Consumer spending was lower while changes in private inventories added a full percentage point to Q4 GDP. Generally speaking this report shows just how much imports can slow economic growth. U.S. Exports curtailed and as a result, -1.7 percentage points of GDP were lost in Q4. Yes America, the trade deficit is back.

As a reminder, GDP is made up of: where Y=GDP, C=Consumption, I=Investment, G=Government Spending, (X-M)=Net Exports, X=Exports, M=Imports*. GDP in this overview, unless explicitly stated otherwise, refers to real GDP. Real GDP is in chained 2009 dollars.
The below table shows the GDP component comparison in percentage point spread from 2016 Q3 to Q4. While the focus will be on trade, note that consumer spending was less in the 4th quarter as well. There are always two revisions after the initial quarterly GDP report release.
| Comparison of Q3 2016 and Q4 2016 GDP Components | |||
|---|---|---|---|
|
Component |
Q3 2016 |
Q4 2016 |
Spread |
| GDP | +3.52 | +1.88 | -1.64 |
| C | +2.03 | +1.70 | -0.33 |
| I | +0.50 | +1.67 | +1.17 |
| G | +0.14 | +0.21 | +0.07 |
| X | +1.16 | -0.53 | -1.69 |
| M | -0.31 | -1.17 | -0.86 |
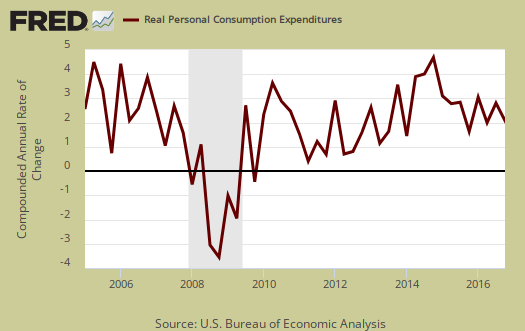
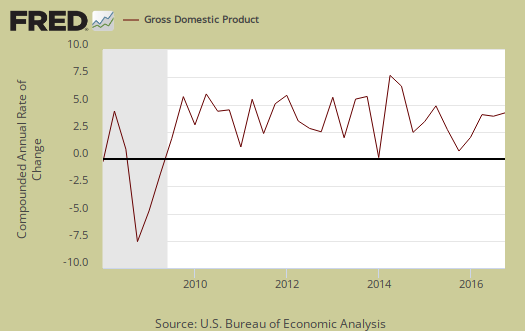
Consumer spending, C was less but not as weak as a year ago. Below is a percentage change graph in real consumer spending going back to 2005.
Goods spending was a 1.11 percentage points of contribution. Durable goods were 0.97 percentage points, a healthy showing while nondurable goods was a 0.32 percentage point contribution. Services were weaker in Q4, with a 0.58 percentage point contribution. Within services, health care was a 0.18 percentage point contribution to Q4 GDP, housing and utilities was 0.43 percentage points and almost half of what Q3 was. Gross output of nonprofit institutions contributed 0.27 percentage points to GDP growth. Graphed below is PCE with the quarterly annualized percentage change breakdown of durable goods (red or bright red), nondurable goods (blue) versus services (maroon).

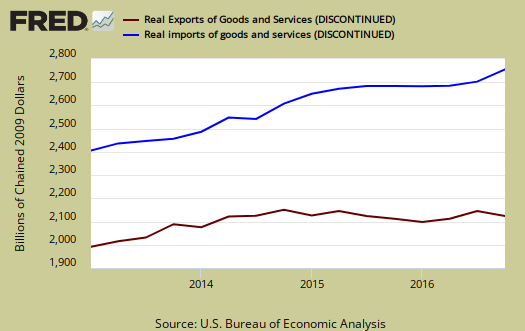
Imports and Exports, M & X dramatically imploded with a -1.70 percent point contribution. This is the advance GDP estimate, hence actual trade data hasn't come in yet and imports are almost always revised. Right now exports by themselves subtracted -0.53 percentage points to GDP and imports reduced Q4 GDP by -1.17 percentage points. The next revision release is next month.
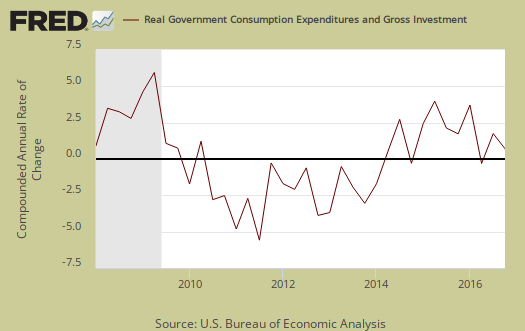
Government spending, G contributed almost nothing, 0.21 percentage points to Q4 GDP. Federal spending was -0.08 percentage points while state and local added 0.28 percentage points. Government spending has been an absentee player since 2010 in GDP growth. That may change if Trump gets his infrastructure building package through Congress.
Investment, I is made up of fixed investment and changes to private inventories. The change in private inventories alone was a +1.00 percentage point contribution. In Q3, changes in private inventories added 0.49 percentage points to GDP. Accelerated growth in private inventories really helped Q4 GDP. Below are the change in real private inventories and the next graph is the change in that value from the previous quarter.


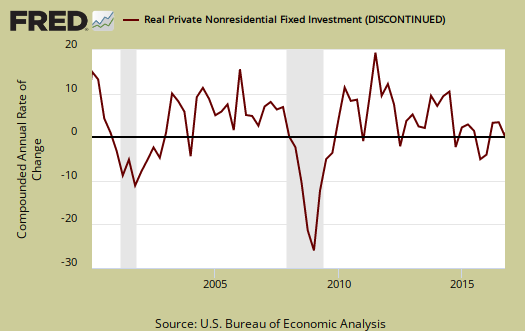
Fixed investment is residential and nonresidential and was a 0.67 percentage point GDP contribution. Nonresidential was a 0.30 individual percentage point contribution Within nonresidential, structures subtracted -0.14 percentage points from GDP and equipment added 0.18 GDP percentage points.
Residential fixed investment was 0.37 percentage points to GDP. The below graph shows residential fixed investment.

Nominal GDP: In current dollars, not adjusted for prices, of the U.S. output,was $18,860.8 billion, a 4.0% annualized increase for Q4 from Q3. In Q3, current dollar GDP increased 5.0%, showing inflation impacted real GDP more in Q4.
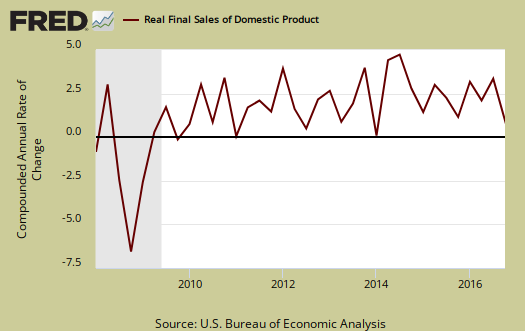
Real final sales of domestic product is GDP - inventories change. This figures gives a feel for real demand in the economy. This is because while private inventories represent economic activity, the stuff is sitting on the shelf, it's not demanded or sold. Real final sales increased 0.9%, which is just terrible.
Gross domestic purchases are what U.S. consumers bought no matter whether it was made in Ohio or China. It's defined as GDP plus imports and minus exports or using our above equation: where P = Real gross domestic purchases. Real gross domestic purchases increased 3.5% in Q4. Exports are subtracted off because they are not available for purchase by Americans, but imports are available for purchase in the U.S. When gross domestic purchases exceed GDP, that's actually bad news, it means America is buying imports instead of goods made domestically.

The price index for gross domestic purchases increased 2.0% for Q4. The PCE price index was 2.2% for Q4 and in Q3 was 1.5%. Without food and energy considered, the core price index increased 1.3%. In Q3, without food and energy considered, was 1.7%. The Federal Reserve's target inflation rate is about 2.0% without food and energy considered.

Below are the percentage changes of the Q4 2016 GDP components, from Q3. There is a difference between percentage change and percentage point change. Point change adds up to the total GDP percentage change and is reported above. The below is the individual quarterly percentage change, against themselves, of each component which makes up overall GDP. Additionally these changes are seasonally adjusted and reported by the BEA in annualized format. Durable goods by themselves showed a a solid 10.9% increase. Goods imports increased by 10.9% Residential investment showed a 10.2% quarterly decrease.
|
Q4 2016 GDP Component Percentage Change (annualized) |
|||
|---|---|---|---|
| Component | Percentage Change from 2016 Q3 | ||
| GDP | +1.9% | ||
| C | +2.5% | ||
| I | +10.7% | ||
| G | +1.2% | ||
| X | -4.3% | ||
| M | +8.3% | ||
This GDP report is really worse than it looks. Much of the bad news was masked by a growth acceleration in private inventories. The trade deficit coming roaring back is no surprise and once again shows how imports really cuts into U.S. economic growth. The weak demand shown by real finally sales was the worst of this report. Mediocre consumer spending didn't help matters. The only goods news is one quarter does not a GDP make and the advance report is often revised beyond recognition to the initial release.
Other overviews on gross domestic product can be found here. The BEA GDP site is here.
a few 4th quarter GDP revisions have been booked
wednesday's report showed that construction spending for all three months of the 4th quarter was higher than was reported by the BEA in their advance estimate last Friday....annualized construction spending for October was revised $7.25 billion higher, and annualized construction spending for November was revised $2.3 billion higher...in reporting 4th quarter GDP, the BEA's technical note (pdf) indicated that they had estimated December residential construction would be $2.2 billion more than that of the previously reported November figure, with single family construction valued at $249.4 billion and multifamily valued at $62.3 billion, and that December nonresidential construction would be $428.0 billion, $1.9 billion less than that of the reported November figure...with this report, December residential construction spending of 466,938 was up by $2.154 billion from the revised November figure, with new single family construction at $250,359 million and new multifamily construction at $63,725 million, and December nonresidential construction spending was at $430,053 billion, statistically unchanged from the revised November figure...hence, total construction spending in December was roughly $4.5 billion more than the figures used by the BEA to compute 4th quarter GDP …...hence, the annualized figure for 4th quarter construction spending would have thus averaged $4.67 billion more than the figure used by the BEA when computing 4th quarter GDP, which would mean that Wednesday's report implies a .12 percentage point upward revision to 4th quarter GDP...
today's factory inventories report indicates the value of non-durable goods' inventories rose by $0.9 billion or 0.4 percent to $241.7 billion, following a revised 1.1% increase in November non-durable inventories...however, the BEA's technical note for 4th quarter GDP indicates that they had estimated that the value of non-durable goods inventories would increase at a seasonally adjusted annual rate of $16.9 billion, so that would indicate that they overestimated the 4th quarter GDP inventory component by about $6.1 billion, which would imply that 4th quarter GDP will have to be adjusted downwards by 0.15 percentage points to account for what today's report shows..
rjs
we'll hold ya to it
But that's none too good. There was a report about GDP still having seasonality in it, despite adjustments on the BEA website.
figuring GDP revisions
it's pretty easy to figure the variance in those reports, where they actually give you what their estimate for the 3rd month of the quarter was when they computed the advance GDP report...others, like the trade deficit, are not so easy...and i still haven't figured out what makes inventories tick...based on my assumptions, i seem to be missing their eventual impact by quite a bit every month..
rjs
PCE easy inventories not
There is much more that goes into inventories than the industrial component, it's in the BEA NIPA handbook...but they also get revision data that can go into GDP but is not yet published in monthly reports. I think they believe no one would bother to track to this level, yet many do and one would think they would simply make it easier on the public since so many do. Maybe it's job security.