
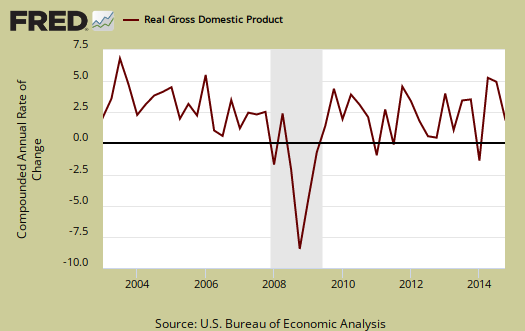
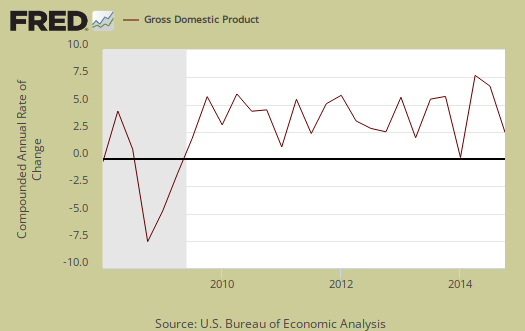
Fourth quarter 2014 real GDP was revised 0.4 percentage points lower to 2.2%. That's quite disappointing, although still mediocre growth. The reason for the revision reduction was inventories did not grow nearly as much as originally estimated and imports increased. Real consumer spending was barely revised. Overall Q4 GDP cutting isn't that surprising, more Q3 GDP's lack of trade deficit impact was.
As a reminder, GDP is made up of: where Y=GDP, C=Consumption, I=Investment, G=Government Spending, (X-M)=Net Exports, X=Exports, M=Imports*. GDP in this overview, unless explicitly stated otherwise, refers to real GDP. Real GDP is in chained 2009 dollars.
This below table breaks down the revisions from the advance report and now in Q4 GDP. As expected imports were revised dramatically up and the changes to private inventories, part of gross investment, was revised significantly downward. .
| Comparison of Q4 Advance 2014 and Q4 2nd Revision GDP Components | |||
|---|---|---|---|
|
Component |
Q4 2014 2nd Revision |
Q4 2014 Advance |
Spread |
| GDP | +2.19 | +2.65 | -0.46 |
| C | +2.83 | +2.87 | -0.04 |
| I | +0.84 | +1.20 | -0.36 |
| G | –0.32 | –0.40 | +0.08 |
| X | +0.42 | +0.37 | +0.05 |
| M | –1.58 | –1.39 | -0.19 |
Q4 is now quite dramatic in change from Q3 and this just goes to show what inventories and imports can do to growth. This below table shows the percentage point spread breakdown of Q4 from Q3 2014 GDP major components and their spread.
| Comparison of Q3 2014 and Q4 2014 GDP Components | |||
|---|---|---|---|
|
Component |
Q3 2014 |
Q4 2014 |
Spread |
| GDP | +4.96 | +2.19 | -2.77 |
| C | + 2.21 | +2.83 | +0.62 |
| I | +1.18 | +0.84 | -0.34 |
| G | +0.80 | –0.32 | -1.12 |
| X | +0.61 | +0.42 | -0.19 |
| M | +0.16 | –1.58 | -1.74 |
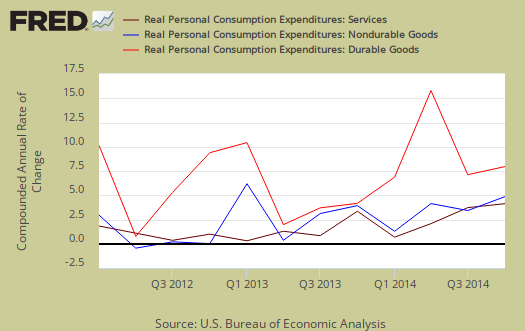
Consumer spending, C is now 68.2% of real GDP and Q4 growth is actually better than Q3. Durable goods were now a 0.44 percentage point GDP contribution, as Motor vehicles & parts consumer spending only added 0.09 percentage points to GDP. Consumer spending services added 1.82 percentage points with health care by itself adding 0.53 percentage points to GDP. That's alot of spending on health care. Food & accommodation services was 0.30 percentage points while financial & insurance was 0.33 percentage points. Below is a percentage change graph in real consumer spending going back to 2000.

Graphed below is PCE with the quarterly annualized percentage change breakdown of durable goods (red or bright red), nondurable goods (blue) versus services (maroon).
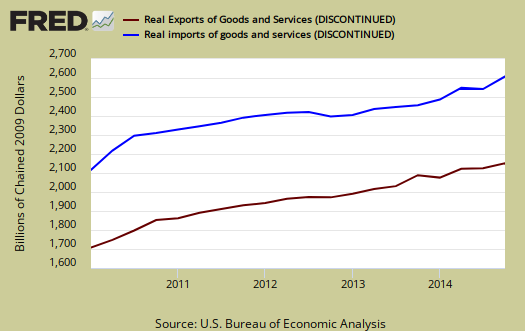
Imports and Exports, M & X really blasted Q4 GDP with a -1.15 percentage point contribution. Exports were 0.42 percentage points as imports were -1.58 percentage points. This shows trade deficits do matter, they stunt economic growth.
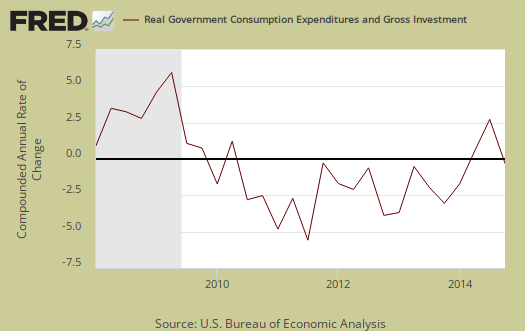
Government spending, G contributed –0.32 percentage points to Q4 GDP, where federal government spending contracted removed -0.54 percentage points of GDP. National defense spending alone subtracted –0.58 percentage points to GDP, whereas state and local government spending added 0.22 percentage points to real GDP.
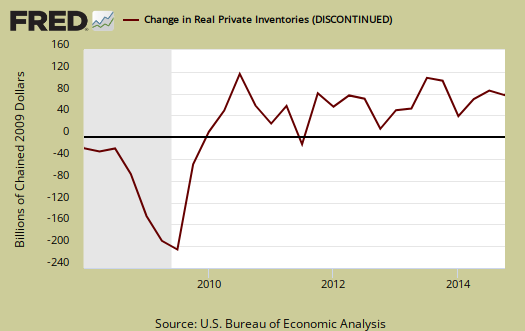
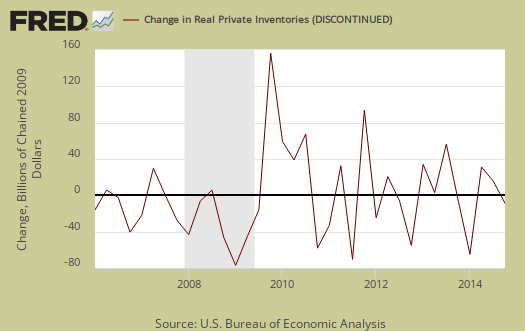
Investment, I is made up of fixed investment and changes to private inventories. Investment contributed 0.84 percentage points to Q3 GDP. The change in private inventories alone was 0.12 percentage point contribution, so businesses are not replenishing their inventories for Q4. Originally changes to private inventories was estimated to be 0.82 percentage points of GDP. Below are the change in real private inventories and the next graph is the change in that value from the previous quarter.
Fixed investment is residential and nonresidential and was revised upward to 0.71 percentage points from 0 .38 percentage points. This is a total revision of 0.33 percentage points from the original Q4 GDP estimate. Nonresidential investment by itself was really revised upward, from 0.24 percentage points of GDP to 0.61 percentage points.

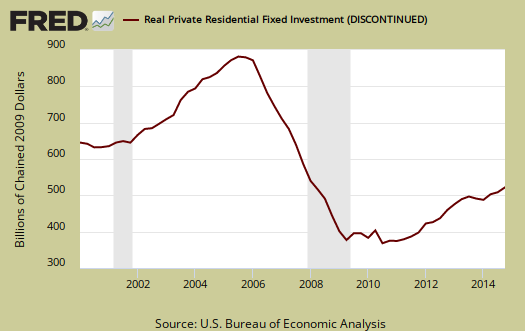
Residential fixed investment added only 0.11 percentage points to Q4 GDP. The below graph of residential fixed investment really shows the housing bubble and the lack of economic growth contribution of residential fixed investment to this day.
Nominal GDP: In current dollars, not adjusted for prices, of the U.S. output,was $17,701.3 billion, a 2.3% annualized increase from Q3. In Q3, current dollar GDP increased 6.4%. This shows how inflation and international prices impact real GDP from the wider variance when not adjusted.
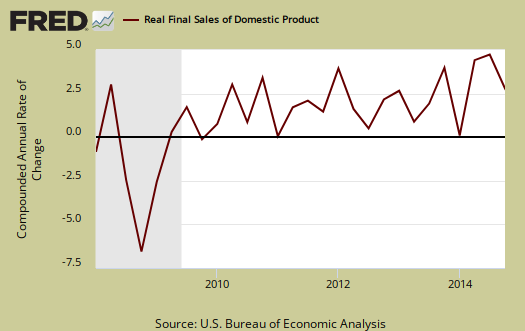
Real final sales of domestic product is GDP - inventories change. This figures gives a feel for real demand in the economy. This is because while private inventories represent economic activity, the stuff is sitting on the shelf, it's not demanded or sold. Real final sales increased 2.1%. Q3 real final sales were 5.0%, so in terms of real economic activity, Q4 growth is less than half of Q3.
Gross domestic purchases are what U.S. consumers bought no matter whether it was made in Ohio or China. It's defined as GDP plus imports and minus exports or using our above equation: where P = Real gross domestic purchases. Real gross domestic purchases increased 3.3%. Q3 was 4.1%. Exports are subtracted off because they are not available for purchase by Americans, but imports, as well a know all too well, are available for purchase in the U.S. When gross domestic purchases exceed GDP, that's actually bad news, it means America is buying imports instead of goods made domestically.

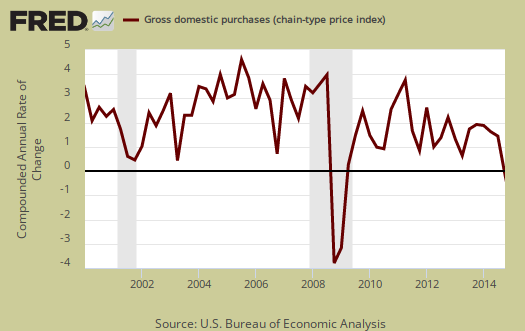
To show how much the drop in oil has impacted everything, below is the price index for gross domestic purchases. It is now negative, -0.1%.
Below are the revised percentage changes of Q4 2014 GDP components, from Q3. There is a difference between percentage change and percentage point change. Point change adds up to the total GDP percentage change and is reported above. The below is the individual quarterly percentage change, against themselves, of each component which makes up overall GDP. Additionally these changes are seasonally adjusted and reported by the BEA in annualized format.
|
Q4 2014 GDP Component Percentage Change (annualized) |
|||
|---|---|---|---|
| Component | Percentage Change from Q3 | ||
| GDP | +2.2% | ||
| C | + 4.2% | ||
| I | +5.1% | ||
| G | -1.8% | ||
| X | +3.2% | ||
| M | 10.1% | ||
Annual 2014 GDP
Quarterly GDP gets a little deceptive as it rises and falls. With this release we realize 2014 wasn't much better than 2013 with a 2.4% annual increase in comparison to a 2.2% annual real 2013 GDP.
Other overviews on gross domestic product can be found here. The BEA GDP site is here.
half the revision was in the deflator...
the deflator was revised from negative to positive 0.1%, and hence the change in current dollar GDP was only revised down by 0.2%, from 2.5% in the advance estimate to 2.3% in this estimate...the deflator for goods was revised from -5.3% to -4.9%, while the deflator for services was revised from 2.0% to 1.8%...current dollar spending for goods was actually $5.4 billion lower in the 4th quarter than in the 3rd..
price indexes for other components saw large revisions as well...dont know how common that is, since i hadnt paid that close attention to it until this quarter...
rjs
Only 2.4 percent for all of 2014?
Wow! Whereas, The Wall Street Journal reported China's economy expanded at 7.4% in 2014 — and that was the slowest in decades! But Bloomberg also reports that it could be much higher. China's economy has already overtaken the U.S. to be the world's largest economy — lifting 500,000 of their people into the middle-class. And by 2022, China could have over 630 million — while the U.S. middle-class continues to decline.
exactly
Q3 was a blow out but Q1 went negative.
Goldman Sachs CEO just said income inequality is destabilizing the U.S. Yes, that's right mega bonus greedy Wall Street, HFT nightmare, playing the carry trade, it's a land of elites and serfs.