
It is clear that we are in an economic environment that we have not seen in over half a century. Statistics that have been generated only since World War 2 cover a period of time which was marked almost exclusively by continuous inflation. The last deflationary recession was in 1949-50.
As a result, many measures that accurately forecast changes in the economy during an inflationary period (for example, a positive sloping yield curve) may not apply now. Thus, I have been looking for statistical measures or comparisons that have data back to 1929, and appear to have given accurate readings even during deflationary periods. In general, it appears that the Kasriel indicator of positive yield curve + M1 money supply consistently growing in an absolute sense, and also faster than inflation did accurately coincide with periods of growth even during the Great Depression. Additionally, M2 money supply growing faster than commercial bank loans also coincided with the onset of recovery even prior to WW2. I have also looked at the role of an increase in the rate of real residential investment compared with GDP as a harbinger of recovery.
Today I will look at a fourth indicator.
This compares nominal and real year-over-year changes in GDP with inflation, CPI. All of these measures go back to 1929. Generally speaking, no useful information is conveyed by this comparison during the inflationary period between 1954-2007. During deflationary periods, however, a consistent pattern does emerge.
This first graph is the deflationary period between 1929-1954. The only inflationary recession during this peiod was that of 1945-6. All of the other recessions, including very mildly the recession of 1954, did feature deflation. In the graph below, CPI (consumer inflation) is in blue, nominal YoY GDP is brown, real GDP is red:
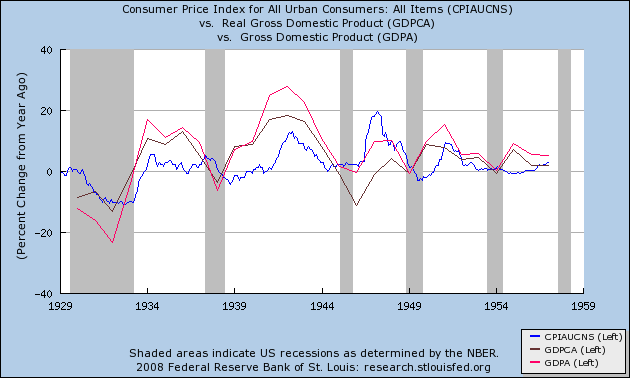
Notice that in all of the deflationary recessions, at some point CPI declined faster than did GDP. Further, in all of the recessions, the CPI always reached that point for nominal (brown) GDP either earlier than or at the same time as it did for real (red) GDP.
Thus, in past recessions, including during the Great Depression of 1929-33, when CPI declined faster than both nominal and real GDP, the recession was more than half the way over. If the rate of YoY GPD growth was increasing (note: this includes times when GDP was in absolute decline, but compared with a year previously, was declining at a slower rate) when the CPI line crossed to the downside, the recession was close to ending.
Here is how the same statistics look for our deflationary recession:
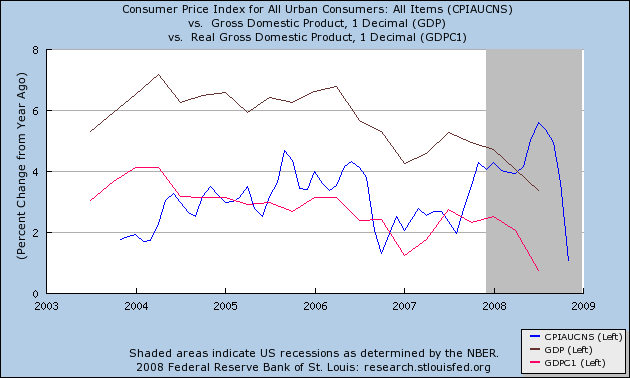
Unfortunately, unlike the monetary indicators, this indicator does not give hope that the recession might be near an end. We don't yet have Q4 2008 GDP, but the estimates are for a substantially negative number. As of November, however, YoY CPI is still at a +1.1%. It is very unlikely that the CPI is going to decline more than YoY GDP growth in either nominal or real terms in the next several months. This indicator, unlike the monetary indicators, suggests that the recession is nowhere near over.
I will continue to watch this indicator, along with the monetary indicators, and real residential investment, for any change in trend that might indicate that this deflationary bust is close to ending.
Recent comments