Bad Bets: Massive EV Subsidies Not Paying Off
Authored by James Varney via RealClearInvestigations,
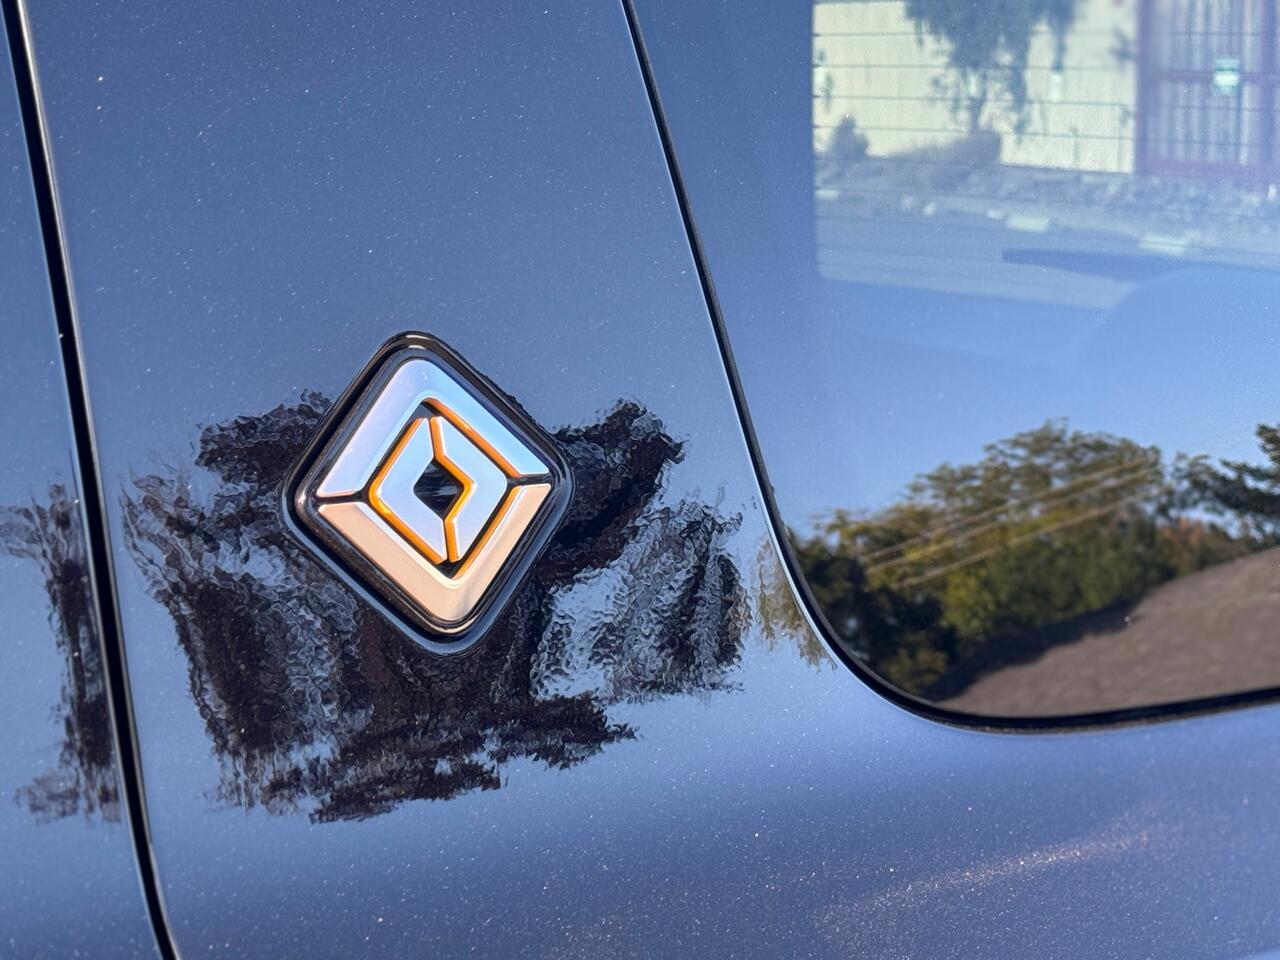
The future was supposed to have arrived this year in a cluster of counties just east of Atlanta in the form of a state-of-the-art factory that would churn out 400,000 electric vehicles a year. But when JoEllen Artz looks about her lifetime neighborhood, all she sees are holes.

“Those shovel holes they made in the ground? That’s it,” she said of the planned site of a Rivian manufacturing plant. “It’s awful, awful.”
The problem is not a lack of funds. On the promise of thousands of jobs, elected officials in Washington, D.C., and Atlanta have pledged some $8 billion to the project, including a $6.5 billion loan the Biden administration green-lit in its final hours.
Those loans are just two of the huge public bets, or investments, that state capitals and Washington, D.C., have made on EVs. While no one has calculated exactly how many federal and state dollars both Republican and Democratic elected officials have sent to that green sector, experts RealClearInvestigations consulted fixed the total north of $100 billion.
Overhanging that massive spending, however, is the issue of demand for EVs, or more precisely, the lack of it. In 2025, Rivian said it sold 25,000 EVs in the U.S., far below estimates of 40,000 to 51,000 vehicles. The company’s revenues were flat in 2024 and 2025, coming in around $5 billion. The Georgia plant was supposed to open this year, but the ribbon-cutting is now slated for 2028, according to the company.
When it comes to electric vehicles, the U.S. consumer has spoken, as Ford CEO Jim Farley said earlier this month. Tesla is one of the few profitable manufacturers, and even its numbers are falling. But while people may not be opening their private wallets for EVs, the public purse for them is bulging. An RCI analysis has identified tens of billions of dollars in federal, state, and local subsidies to support EVs in recent years. Now, in light of market headwinds that show tepid consumer interest in the product and looming competition from China, the likelihood that the taxpayer loans will be repaid is diminishing. Experts say this may result in multiple, costly debacles of public “investments” in green energy projects like the Solyndra loan debacle during the Obama administration, which drew headlines at $500 million.
“This has been a colossal mistake,” said Thomas Pyle, president of the Institute for Energy Research. “This has been one of the worst examples of the government trying to impose its will on carmakers and the public.”
Federal Commitments
Public spending on green energy projects, including EVs, began in earnest in May 2009 when President Obama, flanked in the Rose Garden by Detroit and United Auto Workers executives, unveiled his National Fuel Efficiency Policy. It was, the crowd insisted, “good for consumers, good for the economy, and good for the country.”
There has been bipartisan support for many EV initiatives, and the sector got a huge boost during the Biden administration when funding linked to a NetZero future spread throughout the federal government. The bill goes well beyond the billions of dollars in tax credits the federal government provided to EV buyers until that program was ended last September, and includes school buses, postal delivery vehicles, charging stations, and the big manufacturing loans.
The Energy Department, for example, has spent more than $30 billion. That chunk comes from the Advanced Technology Vehicle Manufacturing division. Prior to 2019, the ATVM, as it is known, had issued around $8 billion in loans to five different companies. Of those, Nissan repaid its $1.4 billion loan, while Tesla repaid its $465 million loan years ahead of schedule. A $5 billion loan to Ford remains active, but taxpayers lost nearly $210 million on loans to Fisker Automotive and Vehicle Production Group, both of which defaulted, according to the department.
Since 2019, however, and especially after the new loan authority contained in the Inflation Reduction Act Biden and congressional Democrats pushed through via reconciliation in 2022, more than $21 billion has been approved for EV-related projects, records show. The $6.6 billion to Rivian was not the largest loan in that portfolio. Instead, a $9.6 billion loan to Blue Oval SK, a joint venture with Ford, for EV batteries and the EV supply chain production topped the bill.
At the Environmental Protection Agency, EV-related spending has topped $6.7 billion, with the lion’s share of that, $5 billion, in grants from its Clean School Bus Program to school districts to buy EV buses.
The EPA has paid between $225,000 and $375,000 per EV school bus, which is roughly three times more expensive than a traditional internal combustion engine bus, and at those prices, it would cost more than $200 billion to replace the nation’s fleet. Such taxpayer largesse has been a boon to the bottom line of school bus manufacturer Blue Bird, but the EPA’s expensive program has suffered myriad setbacks, such as delayed deliveries, bus fires, route distances, and heating the buses in cold weather.
The U.S. Postal Service has spent an estimated $3 billion for EV vehicles in its fleet. A spokesperson said the Postal Service is in the midst of a $9.6 billion “investment” launched in 2022, but they declined to say how much of the remaining $6.6 billion has or would go to buying EVs. At the end of 2025, however, the Postal Service’s proposed EV fleet was running far behind schedule, with Republican Sen. Jodi Ernst ripping the plan as a “boondoggle.”
States Jump In
Some states have labored to force EVs into the market. More than a dozen of them have followed California’s lead, requiring at least 35% of cars offered for sale there annually be “ZEVs,” or “zero emission vehicles,” with all cars being ZEVs by 2035. This complicated, opaque system has made all cars more expensive, according to economists. Congress voted last year to kill California’s plan, but President Trump has not acted on that, and state officials have vowed to sue if he signs it.
On top of the costs of those market manipulations, which can be difficult to compute, are billions in direct state spending on EVs and EV-related projects. Both Republican and Democratic elected officials supporting these moves have done so on the grounds that it would provide an economic boost and be good for the environment.
Rivian, whose corporate communications did not respond to RCI’s request for comment, hasn’t only benefited from the Biden administration’s last-minute loan. In 2022, the state’s Republican leadership in Atlanta pledged up to another $1.5 billion – one of the largest incentive packages in Georgia history – including tax incentives, abatements, support programs, and more than $175 million for land acquisition and improvements. There has been an estimated $25 million in local incentives provided, too.
Georgia Gov. Brian Kemp and House Speaker Jon Burns, both Republicans, attended the groundbreaking ceremony there last September.
“Today is another milestone in bringing quality, good-paying jobs to Georgians in this part of the state,” Kemp said.
The plan has seen repeated delays, however. Currently, Rivian builds its EVs at an Illinois plant, but the company has been losing roughly $39,000 per EV it sells.
Oversight of the sputtering EV project, which was announced in 2021 and is now slated to come online in 2028, has been given to the Joint Development Authority of Jasper, Morgan, Newton, and Walton counties, which did not respond to a request for comment. Opponents said that the maneuver protected the 2,000-acre site from local zoning restrictions.
The delayed timetable of factory construction, along with Rivian’s flat revenue and struggling sales, has led a group of six residents, including Artz, to step up their opposition to the project. They argue the massive construction could damage their water table, but their lawsuit against the plant lost in 2024, although they successfully battled Georgia’s attempt to make them pay legal fees.
“We’re frustrated as taxpayers,” Artz told RCI. “They’ve spent hundreds of millions of dollars on this plant that doesn’t exist.”
In December, Tennessee lawmakers said they might renegotiate a $500 million payment they had offered the Blue Oval SK battery factory in Haywood County after Ford scaled back its EV venture. The joint venture’s new plans will likely involve 1,000 fewer jobs than initially announced in 2021.
In addition, the Tennessee Department of Environment and Conservation noted another $8.5 million spent on EV buses and charging stations, although some of that money may have come from federal grants.
At Volkswagen’s Chattanooga EV factory, a labor dispute erupted with union workers last year after shifts were cut due to low sales numbers, although a tentative agreement on that was announced by the company this month.
The Wrong Incentives
EV supporters insist the vehicles are the future, and that American businesses and citizens need robust incentives to embrace technologies that will stave off the apocalyptic consequences of climate change. As with many other aspects of climate policy, backers have not only argued for the environmental benefits of EVs but have cast them as an economic boon that will create jobs and save consumers money.
“The key is designing incentives that convert new buyers, not subsidizing people who were going to buy an EV anyway,” said Mike Murphy, CEO of EVs for All America, a nonprofit public-education group working to ensure the benefits of electric vehicles reach every community. “A first-time ‘conquest credit’ is simply a smarter use of taxpayer dollars because once somebody switches to electric, data shows 80% stay with EVs. That’s the win for preparing the US auto makers to be competitive in the future car business, which will be dominated by EVs."
Ingrid Malmgren, senior policy director of Plug In America, said the move away from EVs will have dangerous long-term consequences as it “favors a return to fossil fuels over the growth of a clean energy economy.” Malmgren said, “This essentially will shift taxpayer liabilities from funding clean energy and manufacturing jobs to funding fossil fuel subsidies.”
Critics of Biden’s policies counter that the promised benefits of such policies – in a world where China is now by far the largest emitter of greenhouse gases – are dubious. What is clear is that tabulating all the ways the federal government props up the EV industry is a “herculean task,” the American Energy Institute concluded in a report last year, saying “the federal government is running roughshod over sound public policies.”
Institute CEO Jason Isaac said an accounting of the spending is long overdue.
“Taxpayers have spent tens of billions of dollars subsidizing electric vehicles through direct tax credits, manufacturing incentives, charging infrastructure grants, and a web of regulatory mandates that shift additional costs onto consumers,” he told RCI. The dense web of regulations and credits has made spending opaque and “allowed regulators to game the standards in ways that masked the true costs.”
Huge Losses
Outside of government work, the market for EV makers is grim. On Feb. 6, Stellantis announced a $26 billion loss on its EV business. Ford has never been able to entice buyers to an electric version of its F-150 pickup, which for many years has been the best-selling car in America, and two months ago announced it will absorb losses of $19 billion on its EV ventures through 2027. In an earnings call this month, Honda revealed big 2025 EV losses, which have now cost the company close to $5 billion.
In between those staggering hits came General Motors, whose Chief Executive Mary Barra has been an outspoken booster of EVs. Last month, General Motors announced a $6 billion write-off, which, added to previous losses, brings GM’s EV hit to $7.6 billion. The German carmaker Volkswagen has seen declining sales of its EV cars in the U.S. – they fell off a cliff in the last quarter of 2025 after federal payments for buyers ended. VW executives said last year the company remained committed to spending $180 billion on its EV ventures, a slight reduction from initial estimates, but its flagship model, the ID4, is the slowest-selling car in the United States.
The Trump administration would seem to be opposed to massive spending on EVs, as it has said repeatedly that it wants energy policy focused on resilient, reliable, and less expensive energy sources than the renewables that comprise NetZero plans. On Feb. 12, Trump announced he was revoking the Obama-era decree that classified greenhouse gases as a public health issue that should be regulated. That finding has been the main regulatory arch supporting the green energy policies that followed.
Yet it is still not clear what action, if any, the Trump administration will take regarding EVs.
At the Department of Energy, which the Biden administration repurposed as a spearhead in the NetZero drive, a spokesperson suggested little has changed as yet. As always, it can be difficult to pluck specific threads from a quilt of federal spending, but when it comes to EVs and EV-related projects,
Trump energy officials did not identify any specific changes they have made to the Advanced Transportation and Vehicle Manufacturing program, although they indicated some could be in the offing.
“(The Office of Energy Dominance Financing) has completed the thorough review of each project in its portfolio, ensuring that every taxpayer dollar is used to advance the interests of the United States. The review is complete – the actions of de-obligating or revising loans and conditional commitments are still ongoing,” a spokeswoman told RCI. EPA officials said they were “actively reviewing and revamping the Clean School Bus Program.”
Although Biden’s Transportation Department had received wide criticism when news broke last year that it had constructed only eight charging stations as part of its $7.5 billion National Electric Vehicle Infrastructure (NEVI) plan, the Trump administration seems intent on spending that money.
“In just five months since issuing revised NEVI guidance, Secretary (Sean) Duffy was able to obligate 39% more NEVI funds than the Biden Administration obligated in three years,” a spokesman said.
The most recent NEVI stats show some three dozen stations and 148 ports across 12 states, according to tracking by North Carolina State University.
The experts RCI spoke with said a tally of just what taxpayers have provided the EV industry should be made, but agreed that no one has successfully done so.
Similarly, just how much of this spending could be wasted in an industry that has enjoyed government support remains to be seen. But if some of the projects fail, the $500 million lost on Solyndra, which created a scandal at the time, will seem like small beer.
“There have been massive, mounting losses that are going to have to be made up somewhere,” Pyle said. “Washington bludgeoned carmakers into a timetable of efficiency standards and the carmakers went along with it. People should be vehemently opposed to anything mandatory, which in effect is what the government is doing.”
Tyler Durden
Fri, 02/27/2026 - 18:25

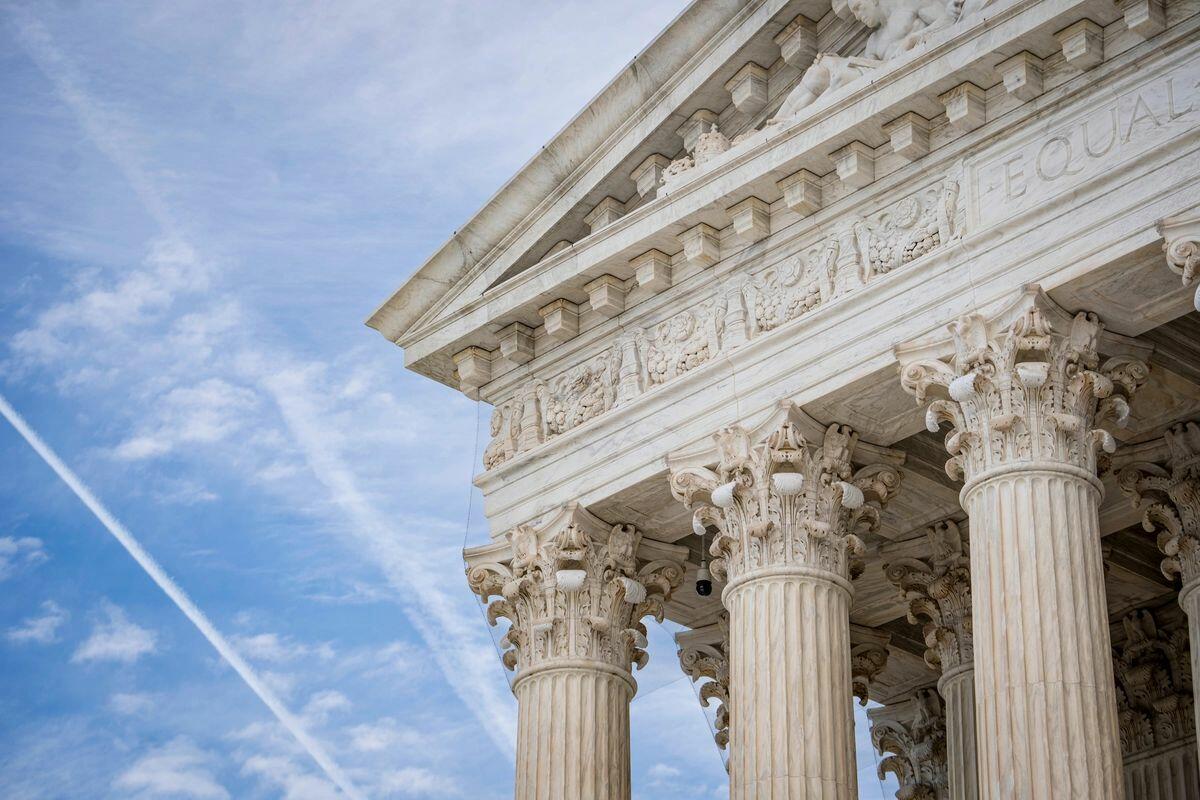 The Supreme Court in Washington on Feb. 21, 2026. Madalina Kilroy/The Epoch Times
 The entrance to the U.S. Citizenship and Immigration Services location where a New York City Council data analyst and Venezuelan national was detained by Immigration and Customs Enforcement while making an immigration appointment, in the Long Island town of Bethpage, N.Y., on Jan. 14, 2026. Shannon Stapleton/Reuters
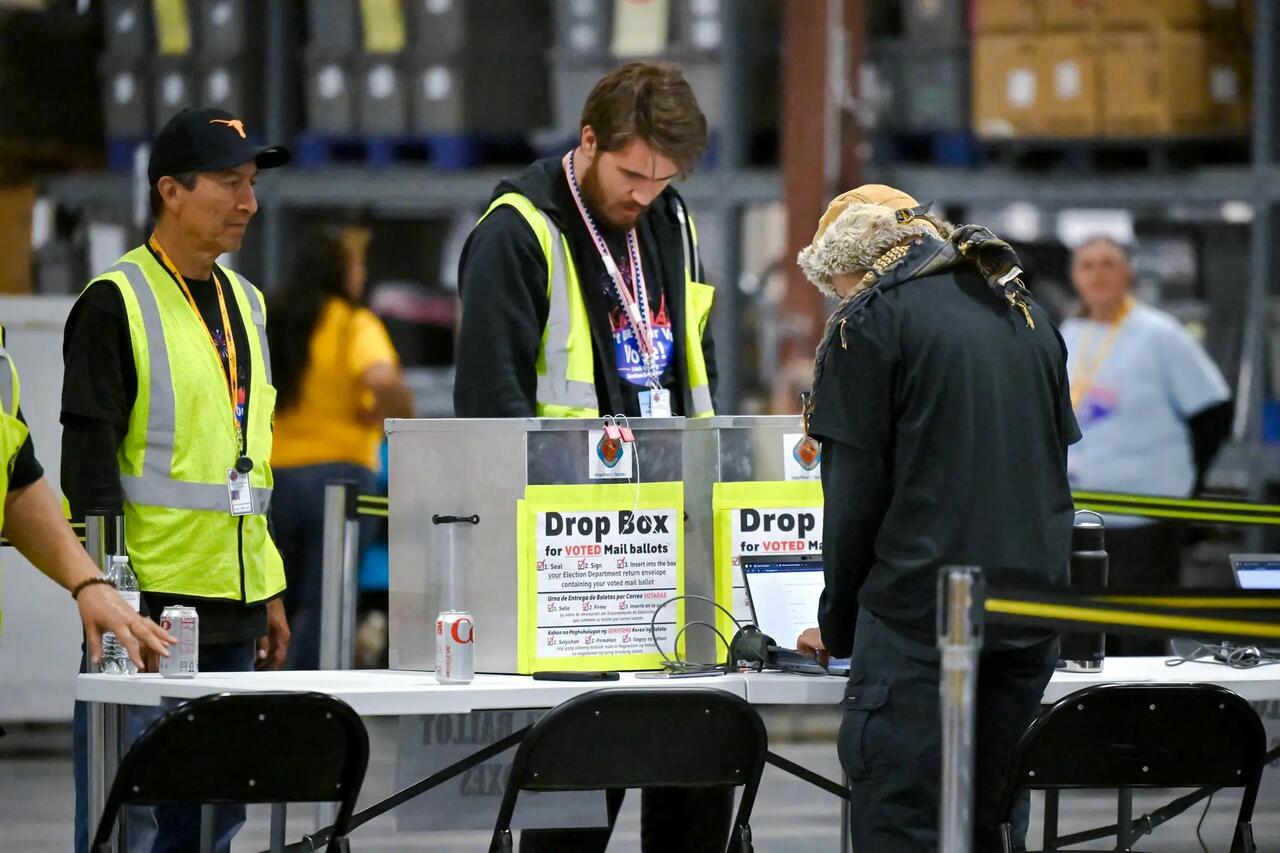 Election workers receive drop boxes for hand delivered mail-in ballots for processing at the Clark County Election Department after polls closed in North Las Vegas on Nov. 5, 2024. David Becker/Getty Images
 A visitor inspects a gun at the National Rifle Association Annual Meeting & Exhibits at the Kay Bailey Hutchison Convention Center in Dallas on May 17, 2024. Justin Sullivan/Getty Images
 U.S. Border Patrol agents process illegal immigrants from Central America near Roma, Texas, on Aug. 17, 2016. John Moore/Getty Images
 via AFP


Recent comments