Transparency: Suing Schools That Hide Trans Kids' Identities From Parents
Authored by John Murawski via RealClearInvestigations,
A few weeks before Christmas in 2022, Amber Lavigne was cleaning her 13-year-old’s bedroom when she stumbled upon her daughter’s secret: a chest binder. She learned that Autumn had been wearing the garment, which girls use to flatten their breasts to achieve a masculine appearance, for about two months at school in Maine, where she had adopted a boy’s name, Leo, and was using he/him pronouns.

It was the first of two chest binders Lavigne found that had been provided to her eighth-grade daughter by a social worker at the Great Salt Bay Community School, according to a federal lawsuit Lavigne filed in 2023, which is now pending before the U.S. Supreme Court. Her lawsuit alleges that the public school not only aided and abetted Autumn’s gender transition but also hid the information from her parents.
“I think it’s important for parents to know that this is occurring in our public schools because I don’t think many parents believe that it’s as bad as it really is,” Lavigne said on a recent podcast. “When I was a kid, one of the first things I heard about adults is if any adult asks you as a child to keep a secret, there’s something wrong with that adult, and you need to come tell me immediately.”
“And now, I mean, it’s like we’re in upside-down land.”
The Maine lawsuit and others like it raise one of the most contentious issues in the broader conflict over transgender policies: whether a parent’s constitutional right to direct their children’s education and medical care extends to a circumstance that society has never grappled with until the past decade or so – a youth’s rejection of their biological sex, adoption of a new name and matching pronouns, and assertion of a new gender identity. And to what extent children who are transitioning or exploring gender options have the right to confidentiality if they worry about rejection and hostility at home.
Growing Backlash
Some 40 such legal actions have been filed in recent years challenging policies that require public school officials to conceal transgender and nonbinary names and pronoun changes from parents at the student’s request. It’s part of a broader backlash that has forced hospitals to discontinue medicalized “gender affirming care” for minors, and spawned more than two dozen medical malpractice suits by “detransitioners” who underwent irreversible sex-change procedures. A jury recently awarded $2 million to 22-year-old Fox Varian, who was given a double mastectomy at age 16.
Queer advocates and their allies say the conservative focus on transgender people – and Donald Trump’s leveraging of the issue in the 2024 presidential campaign – is way out of proportion to the small numbers of trans people in society. Advocates also argue that teens have the right in a free society to express their gender identity without being “outed,” and that affirming their identities reduces rates of depression and suicide.
Critics counter that the cultural impact of such policies extends beyond the small universe of people who identify as trans. Over the past 15 years, advocates have argued that sex is not a biological fact but a socially constructed category; that there are not two but a limitless number of genders; that trans and nonbinary identities are normal and healthy, and that the refusal to acknowledge such genders or use people’s preferred pronouns is discriminatory and abusive. This cultural shift has been advanced by a host of government, corporate, academic, library and K-12 school policies.
Separate Records
The number of K-12 students directly affected by school trans policies over the past decade is unknown, but the total could potentially be several thousand. According to parental-rights lawsuits filed through 2024, about 6,000 public schools in more than 1,200 districts authorized the concealing of student gender transitions from parents. The policies, which can allow a student to access opposite sex bathrooms and sports activities, instruct school officials to send communications home with a student’s birth name, or “deadname,” while keeping a separate set of records at school.
In January, the U.S. Department of Education, citing news coverage, said at least 300 students in California were put on “Gender Support Plans” during the 2023-2024 school year, many without parental consent or knowledge. And a 2023 Supreme Court petition said a Montgomery County Board of Education spokesman in Maryland stated that there were more than 300 secret transitions the previous year in that county alone.
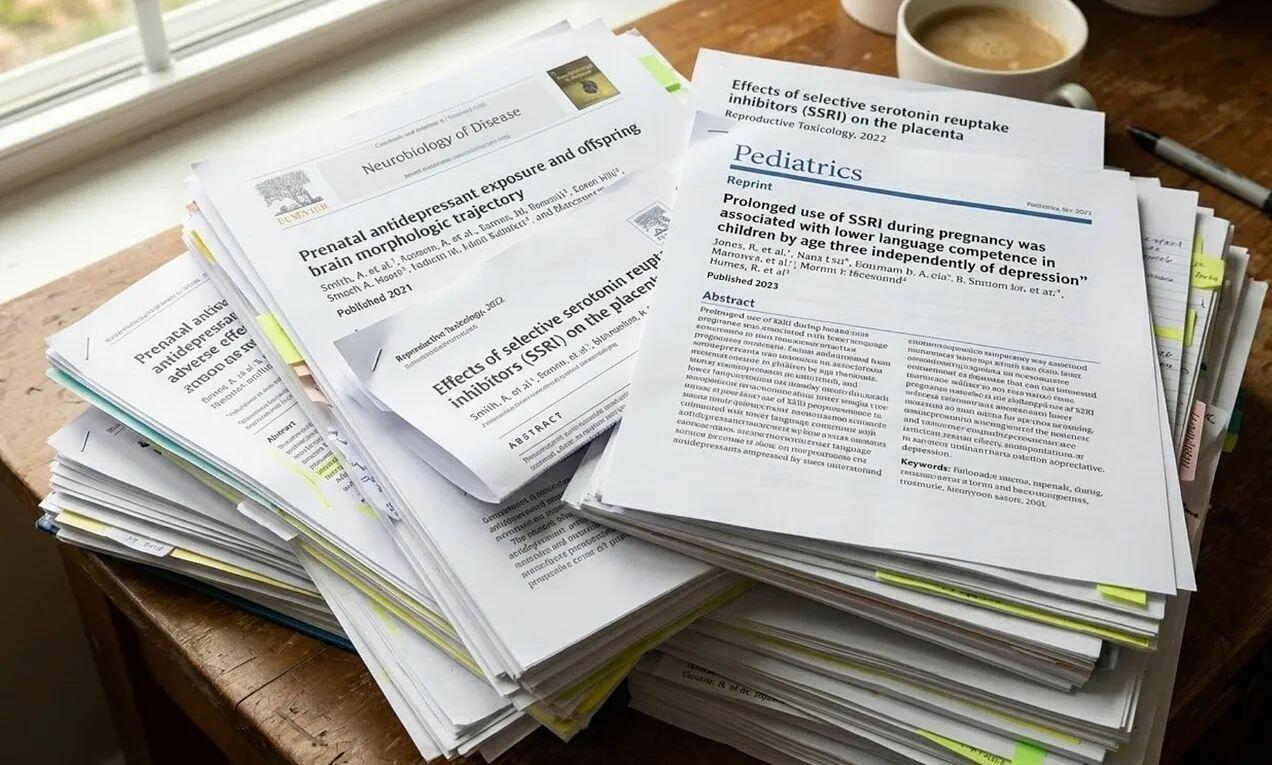
The issue is especially fraught because research cited in the parents’ lawsuits indicates that up to 90% of children will not persist in feelings of gender incongruence if left alone. But once young people commit to a social transition with a new name and pronouns, a majority will lock into a gender incongruent identity and continue transitioning.
Some parents and jurists are also concerned about the appropriateness of the information schools are providing students. In an Ohio case dismissed on procedural grounds, a federal appellate judge appointed by President Trump wrote that the parents’ allegations about their secretly transitioning ninth-grader who attempted suicide were “beyond troubling.”
The judge noted: “The parents also learned that teachers wore badges with QR codes that students – who are young children – could scan to access pornographic content and obscene material instructing children about sexual acts.”
Some school officials see themselves as protectors of students against what they detect as bigotry from parents and society. According to a Massachusetts lawsuit, which is pending at the Supreme Court, parents learned from a teacher that their sixth-grader was secretly affirmed as “genderqueer” at school and received transgender resources from the school’s “nonbinary librarian”; the teacher was promptly fired for notifying the parents, and the district superintendent said at a public meeting that claims of “parental rights” to know about student gender identities are thinly veiled camouflages for intolerance against LGBTQ students.
The school district in Massachusetts says that parents are asserting rights that simply don’t exist.
“There is no case cited by [parents] that stands for the proposition that a parent is entitled to notice of their child’s gender so that they can control it (or attempt to do so),” Ludlow Public Schools told a federal appeals court in 2023. “While the age of a child may have some bearing on the relevant analysis, no court has established a rule that establishes a parent’s asserted right trumps the rights of an eleven-year-old or twelve-year-old who asserts their gender identity.”
Lavigne’s lawsuit is one of seven such parental rights cases seeking review at the Supreme Court. While the high court has so far rejected three petitions, lawyers who represent the parents say it’s only a matter of time until the justices agree to hear a case on K-12 gender transition policies.
Wide-Ranging Lawsuits
The Supreme Court has heard four transgender-related lawsuits in the past two-and-a-half years. The court has sided with conservative states challenging medicalized sex-change treatments for minors. Last year, the justices sided with religious parents objecting to queer-themed books in K-12 schools. Another major case, argued in January, is whether women’s sports should be accessible to natal males who identify as trans women. A number of other trans policies are working their way through the lower courts – such as challenges to government-imposed misgendering/deadnaming bans, and challenges to adoption agencies that disqualify parents who believe there are only two genders. In a parental rights case out of Wisconsin that the Supreme Court declined to hear on procedural grounds, a group of Wisconsin parents challenged secret gender transitions and alleged that an activist teacher had posted a flyer in her classroom, proclaiming: “If your parents aren’t accepting of your identity, I’m your mom now.”
In an accompanying opinion, conservative Justice Samuel Alito argued that schools’ “Gender Support Plans” for trans kids raise serious constitutional concerns.
“This case presents a question of great and growing national importance: whether a public school district violates parents’ ‘fundamental constitutional right to make decisions concerning the rearing of’ their children, when, without parental knowledge or consent, it encourages a student to transition to a new gender or assists in that process,” Alito wrote.
Alito noted: “As school personnel were told in an equity training session: ‘parents are not entitled to know their kids’ identities. That knowledge must be earned.’”
According to court filings and public records, school officials go to great lengths to hide what they’re doing. In a New Jersey case, school officials agreed to call a 14-year-old girl by a boy’s name and use male pronouns in school, but were instructed to announce the student’s birth name over the intercom system to conceal the gender transition from a sibling at the same school. In a 2023 article, The New York Times described a delicate situation in which a middle-schooler had secretly changed names and pronouns without the mother’s knowledge, even though the mom worked as a teacher at the same school. In some cases, the concealment continues for several years, until the student graduates from high school.
Courts that have taken the side of the schools have said that the privacy rights of trans kids outweigh parental rights, that schools have a legal duty to protect gender-nonconforming kids from discrimination, that lack of parental acceptance could create an unsafe home environment, and that respecting a student’s preferred name and pronouns is just basic courtesy.
In the Massachusetts case, a panel of three judges at the U.S. Court of Appeals for the First Circuit, appointed by Presidents Obama and Biden, dismissed the parents’ claims, ruling that a school secretly supporting an 11-year-old who is “genderqueer” does not rise to the level of shocking the conscience, and in fact is quite mundane: “Providing educational resources about LGBTQ-related issues to a child who has shown interest imposes no more compulsion to identify as genderqueer than providing a book about brick laying could coerce a student into becoming a mason.”
In Lavigne’s case in Maine, her lawsuit was dismissed by a federal trial court in 2024 and again by a federal appeals court in 2025 for failing to establish that the school system had a permanent or well-settled policy of hiding gender transitions from parents.
Ugly Disputes
Lavigne’s case shows how ugly these disputes can get at the local level.
After she found the chest binder, Lavigne filed a complaint to a licensing board against two school social workers whom she believes were secretly supporting Autumn’s gender transition to “Leo.” Several days later, an agent from the Maine Office of Child and Family Services appeared at Lavigne’s door in response to an anonymous complaint alleging that Lavigne was emotionally abusive towards her daughter.
The agent spent several hours interviewing Lavigne and her family members, Lavigne said, but after a month, the case was closed without finding evidence of neglect or abuse. Lavigne now speaks publicly on the issue at local school board meetings and parents’ rights events.
“You’re very impressionable when you’re 12, 13 years old,” Lavigne said in a phone interview. “Someone is telling you that the root of your distress is ABC, and you’ll do anything to relieve that distress.”
Meanwhile, as the story spread, the school was subject to bomb threats and threats against school staff by those who opposed its transgender policies. School officials said the commotion was caused by “a grossly inaccurate and one-sided story,” forcing the school to shut down on three days.
Some of the parents’ lawsuits have backing from Erica Anderson, a clinical psychologist and a former board member of the World Professional Association for Transgender Health (WPATH). Anderson, who is transgender, has gained notoriety since breaking ranks with the trans establishment and accusing its leaders of recklessness and overcorrection for being too quick to affirm trans identities and prescribe hormonal interventions and irreversible surgeries to kids who may be struggling with autism, homosexuality, trauma, or other problems, and would have otherwise outgrown their nonbinary or trans phase.
“School is now like Las Vegas: ‘What happens at school stays at school,’” Anderson wrote in court filings. “It should go without saying, but parents cannot obtain a professional evaluation, screen for dysphoria and other coexisting issues, or provide professional mental health support for their children, if their school hides from them what is happening at school.”
The tide of clandestine transitions appears to be turning. Florida’s Parental Rights in Education Act, passed in 2022 and decried by queer advocates as the “Don’t Say Gay” law, forbids public schools from hiding gender transitions from parents. At least 12 other states have recently enacted statutes that address parental notice or consent regarding students’ gender identity, according to court filings. Last year, the U.S. Department of Education alerted public schools that it “will no longer passively accept school officials’ hostility to parental involvement” on matters of “gender ideology.”
The Trump administration currently has open investigations of the Maine Department of Education, Washington State Superintendent’s Office, four Kansas school districts, and Fairfax County Public Schools for similar practices. Trump has featured mothers whose kids were secretly transitioned at his last two State of the Union speeches to Congress.
California Doubles Down
California has been moving in the opposite direction. Last year the state enacted the Safety Act, or AB 1955, that prohibits teachers from notifying parents about student gender identities. The California Department of Education and state Attorney General Robert Bonta are taking enforcement actions against school districts that refuse to comply with the state ban, and instead tell parents if their kids are adopting new gender identities.
In federal court filings, Bonta says that LGBTQ students live in continuous fear of being outed, exposed to harassment, and potentially driven to suicide.
To illustrate his point, Bonta quoted a transgender student who spoke in favor of California policy at a public hearing: “If a student is outed to their family without their consent, this could possibly result in abuse, hate crimes, getting kicked out of their homes, [and] in extreme cases, being murdered.”
When debating the bill, the California Legislature was presented with statistics that 57% of LGBTQ youth reported parental rejection, ranging from mocking to physical abuse and being kicked out of the home.
The U.S. Department of Education responded by launching an investigation of California’s K-12 practices, and this year the feds said that California’s public school personnel have gone “to great lengths” to conceal children’s gender transitions, such as petitioning the software company used in many California schools to create features that hide student name changes and pronouns from parents.
Several parents and teachers have filed a class action lawsuit to block California’s school policies, winning in the lower court, but losing on appeal. On Monday this week, the Supreme Court sided with the parents, blocking California’s school policy. The high court said in its 6-3 ruling that the parents are likely to prevail and therefore entitled to the trial court’s December judgment in their favor, enjoining California’s policy while the state tries to overturn that judgment on appeal.
“One set of parents learned of their child’s transition at school only after the child attempted suicide,” Justices Amy Coney Barrett, Brett Kavanaugh and Chief Justice John Roberts wrote in a concurrence. “Strikingly, even after this tragic event, school administrators continued to withhold information about the student’s gender identification.”
At the trial court, U.S. District Judge Robert Benitez, who was appointed to the bench in 2002 by George W. Bush, decried a “trifecta of harm” against children, parents and teachers, in a scathing critique of the state’s policies in December:
“The difficult and long lasting issues of gender nonconformity leave parents to suffer adverse consequences over a lifetime,” Judge Benitez wrote.
The harm in question is described in the class action lawsuit, in which one set of parents allege that their junior-high daughter was being treated as a male for nearly a year, and then attempted suicide. They didn’t know that their child was presenting as a boy in school until they learned it from a doctor at Fremont Hospital, where the student was admitted in the inpatient psychiatric program for adolescents after her suicide attempt.
The parents and teachers are represented by attorney Paul Jonna, who said in a phone interview that one problem with the trans advocacy position is that school officials assume that anything short of automatic affirmation means that parents are motivated by transphobia.
“They are grossly exaggerating the harassment,” Jonna said. “Their position essentially is: If the parent is not automatically affirming, not excited about your new gender identity, then they’re harassing and abusive.”
As for Lavigne’s daughter, she never made the transition to the male gender. Autumn is now a 16-year-old 11th-grader at another school. She is back to using her birth name and female pronouns, Lavigne said.
“It was a process for her,” Lavigne said. “After many years of connectedness to her family, many years of connectedness to her body.”
Tyler Durden
Tue, 03/10/2026 - 19:35

 Pictured: President Donald Trump holds up an executive order on the rapid development, deployment and use of advanced nuclear technologies, on May 23, 2025, in the White House. (Photo by Win McNamee/Getty Images)
 Launchers From THAAD Anti-Missile System
 Testosterone-deprived 'man' 'lifts' weights in his mother's basement in front of a chemical symbol (illustration: Epoch Times, Shutterstock)
 Yonaguni Island, Japan’s westernmost inhabited island, about 111 kilometers from Taiwan, is pictured in Yonaguni, Japan, on April 13, 2022. Japan’s southwestern islands lie close to Taiwan, and any conflict there could threaten Japan’s sea lanes, airspace, and U.S. bases on its territory. Carl Court/Getty Images

 He knows what Willis is talkin' 'bout...


Recent comments