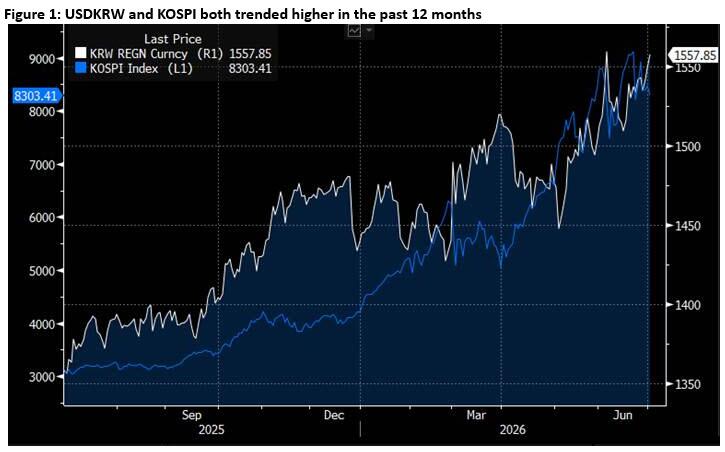
Futures On Edge As Sliding Chips Spark Another Korea Crash, Payrolls On Deck
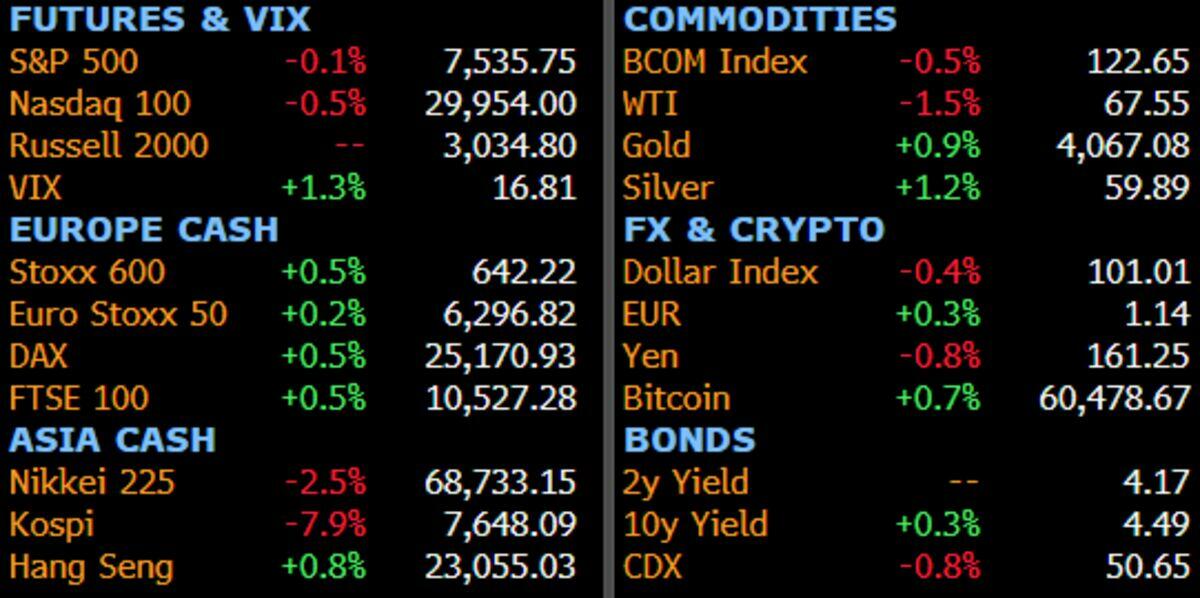
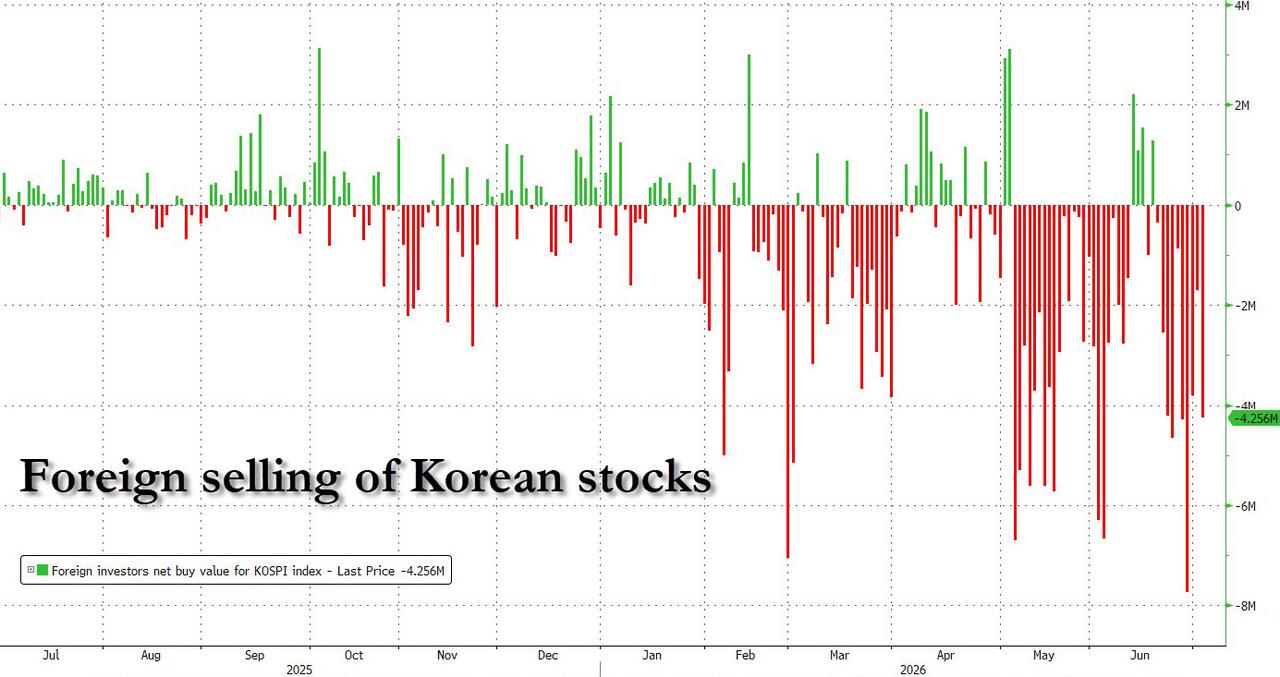
US equity futures have reversed all overnight losses which were driven by the latest crash in South Korean stocks, which plunged 8% and closed at LOD, driven by a plunge in memory stocks. Still, the Nasdaq is still lower with tech stocks depressed on news that Sam Altman's OpenAI is seeking to offer a 5% stake to Trump in what is clearly an attempt to incentivize the government to backstop the company whose revenues are clearly below budget. As of 8:00am ET, S&P futures are up 0.1%, while Nasdaq futures drop 0.2% after semiconductors and high beta momentum led Wall Street lower in the previous session; the latest bout of tech volatility entered a second day, with chipmakers in South Korea bearing the brunt of the selling. SK Hynix and Samsung Electronics lost a combined $290 billion in value to drive a 7.9% slump in South Korea’s Kospi index. In Europe, the Stoxx 600 rose 0.6%, with technology among only two of the 20 index sectors to lose ground. Elsewhere, the dollar fell, as USDJPY suffered a sudden plunge on intervention concerns, and US 10-year yields +2bps at 4.50%, WTI -1.49% @ $67.55. All eyes on NFP later this AM (consensus at +113k, see our preview) and subsequent Fed pricing (market currently pricing in ~30% chance of a hike at July meeting) following yesterday’s Momentum drawdown (High Beta Momo finished -9.62%, second worst day YTD, top 5 worst days over last 5 years). So far the spillover from overnight price action has been limited, with KOSPI -7.89%, NKY -2.5% as yesterday’s META headlines continue to drive anxiety around overcapacity fears.

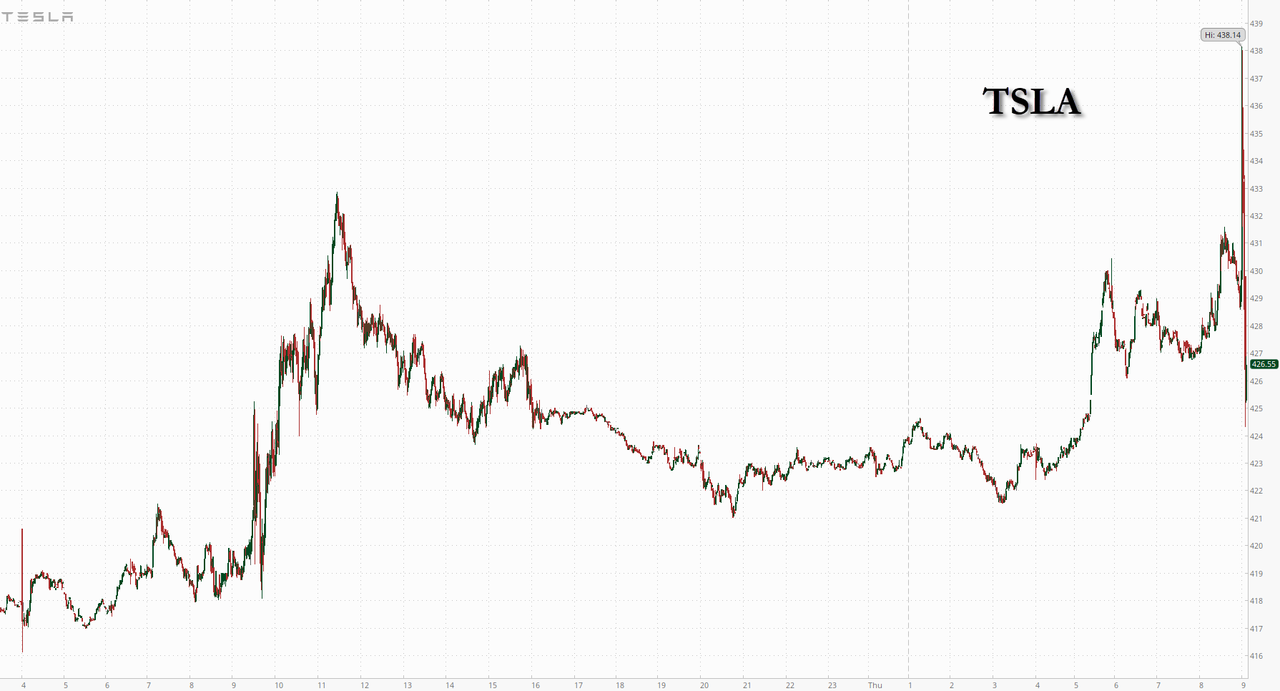
In premarket trading, Mag 7 stocks are mixe: ( Microsoft +0.7%, Apple +0.4%, Tesla +0.5%, Amazon +0.6%, Meta +0.3%, Alphabet -0.6%, Nvidia -0.5%)
- Cloud and other AI infrastructure stocks (CRWV -1.1%, IREN -2.2%, AMD -1.4%, INTC -1.3%) are extending losses as Meta’s plan to develop a business that would sell access to AI computing power raised worries about overcapacity.
- Adobe Inc. shares (ADBE) are up 2.8% after HSBC upgraded the software company to buy from hold.
- Chevron Corp. shares (CVX) rise 0.6% after Wolfe Research raised its recommendation on the energy company to outperform from peerperform as it sees free cash flow driving growth.
- Honeywell Aerospace Inc. shares (HONA) are up 0.3% after BMO Capital Markets started coverage on the company with an outperform rating and $276 price target.
- Infleqtion Inc. (INFQ) rises 3.7% after Canaccord Genuity initiated coverage with a recommendation of buy.
- Palantir Technologies Inc. shares (PLTR) rise 3.7% after DA Davidson & Co raised its recommendation to buy from neutral as it sees the technology company having a competitive advantage to artificial intelligence companies that have been at odds with the US government.
- Waystar Holding Corp. shares (WAY) are up 1.9% after KeyBanc Capital Markets started coverage on the healthcare software company with an overweight rating and $30 price target.
The frequent swings in the market’s biggest drivers come as traders react to any sign that a near-parabolic rally in chipmakers, the biggest beneficiaries of the vast outlays on AI infrastructure, has run too far (spoiler alert: it has). In the latest instance, Meta’s plan to sell computing power raised questions about a glut of capacity. The Kospi, the poster child retail-driven momentum chasing idiocy and the AI trade, fell 7.9% after memory heavyweights Samsung and SK Hynix were rattled by news that Apple is in talks to buy chips from two Chinese semiconductor makers on a Pentagon blacklist to help reduce the impact of a global memory shortage.
Meanwhile, investors are rotating into laggards that stand to benefit from a strengthening economic outlook just as money-market bets on tighter monetary policy recede. Consumer-orientated stocks led gains in Europe on Thursday, tracking Wednesday’s US moves when a majority of S&P 500 stocks advanced. By contrast, memory, storage and processing names were again among the biggest decliners in US premarket trading. Sandisk, Seagate and Dell were all down 3% or more.
“The market recognizes the risks associated with a potential overvaluation in the tech sector,” said Guillermo Hernández Sampere, head of trading at MPPM. “Whether a major shift away from the tech sector is underway will become apparent by the next round of quarterly earnings reports.”
Investors will also focus on the US jobs report at the end of a holiday-shortened week. The data will offer fresh clues on the path for interest rates after comments Wednesday by Federal Reserve Chair Kevin Warsh dampened speculation of a hike this year.
For jobs report at 8:30am New York time, Bloomberg’s crowd-sourced whisper number for nonfarm payrolls change is 138k vs median economist estimate of 113k; unemployment rate is expected to remain at 4.3%.Bloomberg Economics anticipates a hot payrolls report will show the US economy added 200,000 jobs in June. That would be a third straight extremely strong print, with the three-month average job increase likely clocking in at 183,000.
“A strong payrolls report — particularly if we see healthy gains in hourly wages — would likely increase market bets on rate hikes this year,” according to Bloomberg Economics’ Anna Wong.
Our full preview is here; in its preview Goldman estimates nonfarm payrolls rose by 130k in June, above consensus of +115k. On the positive side, the bank estimates that the World Cup could boost payroll growth by 40k in June. Additionally, June payrolls have exhibited a consistent positive bias in initial prints over the last decade which has been particularly pronounced in state and local government education services payrolls. On the negative side, GS expects a 10k decline in government payrolls outside of state and local government educational services.
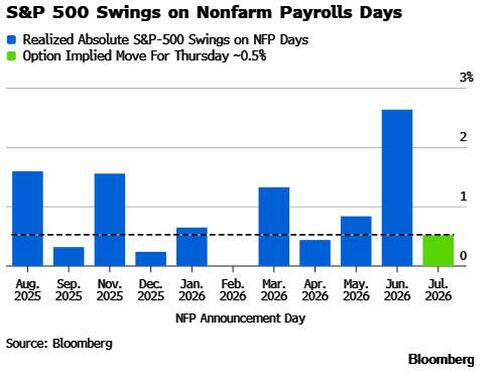
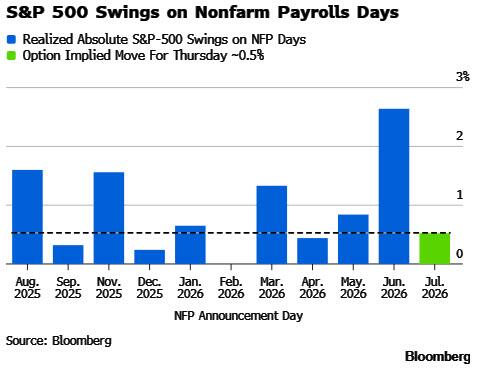
The options market is pricing in a roughly 0.5% move for the S&P 500 in response to NFPs, according to Bloomberg calculations, broadly in line with last month’s muted expectations despite the June release triggering a 2.6% selloff.
European stocks rose as investors looked for alternatives to expensive tech shares in more defensive sectors. Technology significantly underperforms, while personal care, food and beverage stocks outperform. The Stoxx 600 index rises 0.5% to 642.64 with 422 members up, 167 down and 11 unchanged. Here are the biggest movers Thursday:
- Sodexo rises as much as 10%, the most since April 2023, after the French food services company reported third-quarter results ahead of expectations and raised its organic revenue forecast for the full year
- CTS Eventim rises as much as 6.1% after Oddo BHF upgrades the stock to outperform, saying its de-rating of about 50% over the past year leaves the live events company trading at deeply discounted multiples and an appealing valuation
- SKF shares rise as much as 5.9%, the most since June 15, after the Swedish ball-bearings group signed an agreement with Leaderdrive to establish a venture in China
- Carrefour shares rise as much as 5.1%, the most in just under a year, after UBS upgrades the French grocer to buy from neutral, calling the stock “too cheap to ignore”
- Amplifon rises as much as 5.5% in Milan trading after Equita raised the Italian hearing-aid company’s stock to buy from hold, citing its competitive position, visible synergies and the discount at which the shares trade
- Cloetta shares rise as much as 8.5%, the most since early May, after the Swedish confectioner announced a deal with US grocery chain DeCicco to introduce Swedish pick-and-mix-style candy in its New York stores
- Hemnet gains as much as 13%, the most in almost two years, as JPMorgan flagged improving June listings data. Today regulatory filings also showed Hemnet’s third-biggest shareholder, GCQ Funds Management, has increased its stake
- Currys shares drop as much as 5.3% after the electronics and appliance retailer signaled it’s comfortable with the analyst consensus, which may signal limited upside to estimates for the time being
- Baltic Classifieds Group shares drop as much as 12%, the most in seven months, after the online classifieds operator issued weaker-than-expected fiscal 2027 guidance and reported a slight revenue miss for 2026
- European semiconductor stocks fall, tracking an overnight selloff in US peers
Asian stocks headed for the lowest close in three weeks as concerns over excess AI capacity and intensifying competition sparked a selloff in high-flying chip shares. The MSCI Asia Pacific Index slid 1.4%, with South Korea’s Kospi tumbling almost 8% to lead regional declines. Samsung Electronics and SK Hynix lost at least 9% each to be the biggest drags on the regional benchmark, while TSMC and Japan’s Kioxia also slumped. The moves followed losses in US semiconductor shares that saw Micron Technology and Sandisk plunge more than 10%. The selloff came as Meta Platforms’s reported plans to build a cloud infrastructure business that would sell access to AI computing power and models fueled concern the company may have overbuilt its capacity. Separately, Apple is in talks to buy chips from two Chinese semiconductor makers, according to people familiar with the matter, which would hurt South Korean manufacturers. The iPhone maker late last month raised prices of all Macs, iPads, home devices and the Vision Pro, stoking concern that rising costs may start to curb demand and spurring a broad rout in global tech shares at the time. Equities in India and Southeast Asia bucked the regional selloff while stocks in Hong Kong also rose on return from a public holiday.
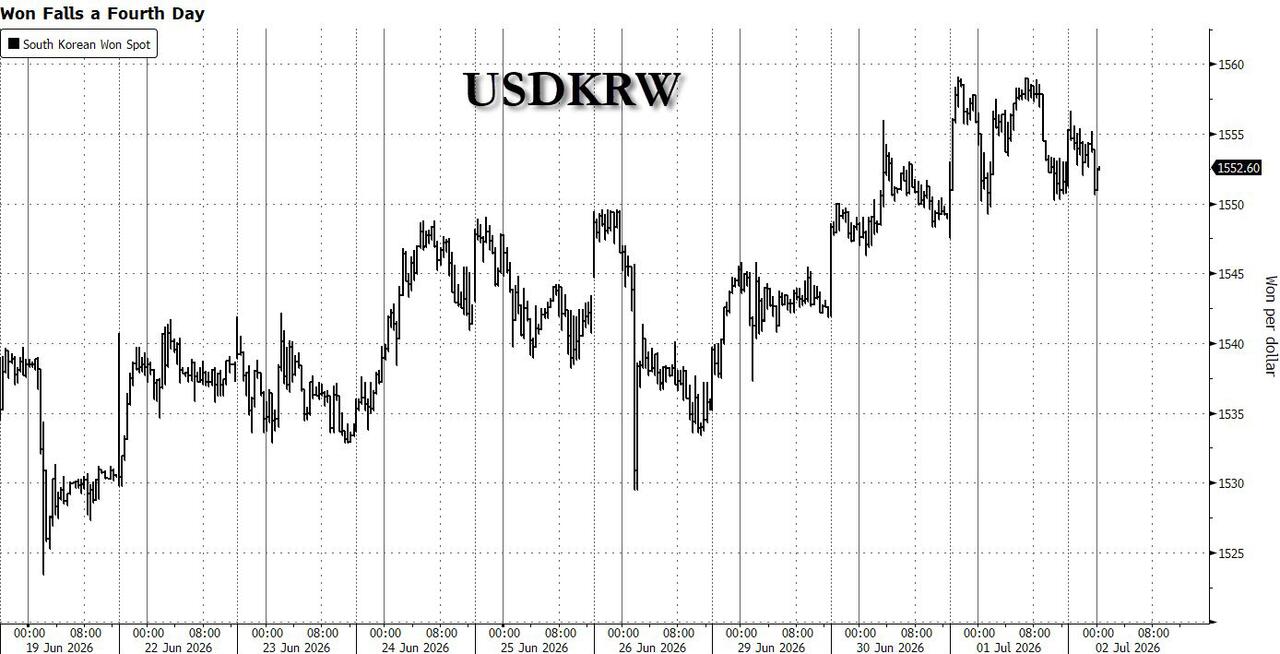
In FX, USD/JPY has been on the move with the pair down around 130 pips. The move was set in motion by comments from South Korea that is was closely communicating with the US and Japan on FX intervention, before experiencing a much steeper decline. Reporting via Reuters notes that Japan could shift to surprise Yen intervention tactics. The Bloomberg Dollar Spot Index is down 0.3%, enabling EUR/USD to return to a 1.14 handle.
In rates, treasuries are under slight pressure ahead of the release of June employment data with potential to alter the outlook for a Fed rate hike at the end of the month. US long-end yields are 1bp-2bp cheaper with front-end tenors little changed, steepening 2s10s spread by 2bp. 10-year is near 4.49%, 1.4bp higher on the day, with bunds and gilts in the sector lagging by 3bp and 4bp. About 8bp of Fed tightening is priced in for the July 29 policy decision, 35bp by the end of the year. European benchmarks are being sold to a greater extent with 10 year yields in Germany and the UK up 4 basis points each. With US markets closed Friday, jobs report is being released a day earlier than normal, and Sifma recommended 2pm close for cash trading.
In commodities, WTI crude is lower for a third consecutive day, back below $68 a barrel, as flows through the Strait of Hormuz improve and there are signs of progress in indirect talks between the US and Iran. Precious metals are building on yesterday’s gains with spot gold and silver up 1% and 1.4% respectively. Bitcoin adds 0.7%.
Today's US economic data calendar also include weekly jobless claims (8:30am) and May factory orders with durable goods orders revision (10am), Fed speaker slate includes Daly at 7:45am in moderated discussion at a Banco de España conference.
Market Snapshot
Top Overnight News
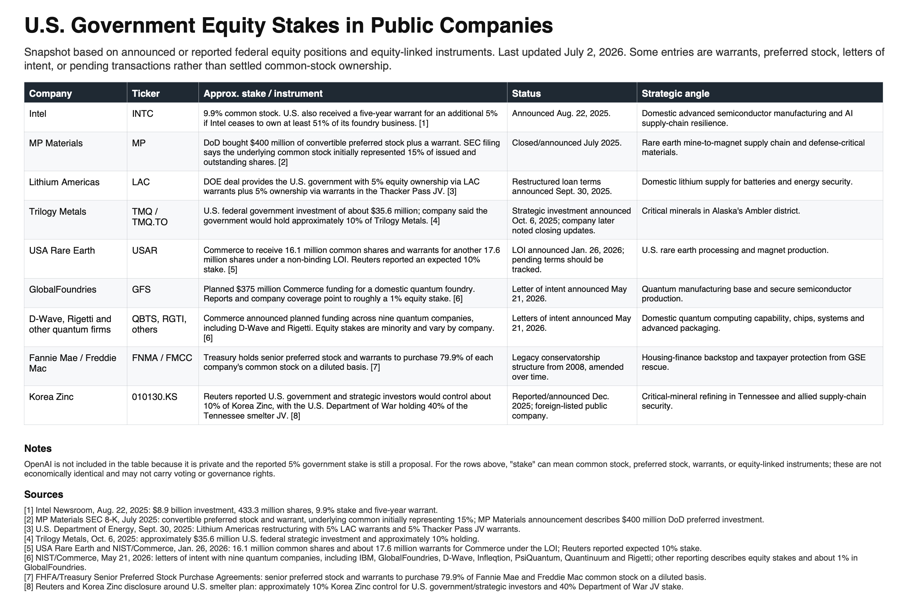
- OpenAI has discussed giving a 5% stake to the US government as the $852bn AI start-up seeks to clear political obstacles by securing financial buy-in from the Trump administration. FT
- The definition of circular funding: Nvidia is using its balance sheet to help more companies buy its expensive AI chips: The Information
- Iran’s struggling to find buyers for its oil before a 60-day window granted by the US expires. More than 58 million barrels of its crude and condensate was on the water as of July 1, but over 90% has no clear destination. BBG
- At least five supertankers carrying a total 10 million barrels of Saudi oil loaded from Ras Tanura have exited the Strait of Hormuz, with Saudi Aramco switching to spot pricing to speed sales in Asia, according to trade sources and shipping data. RTRS
- Sales of cars, air conditioners and TVs fell rapidly in China last month as the impact of government subsidies faded, raising pressure on policymakers to stimulate the economy. Nikkei
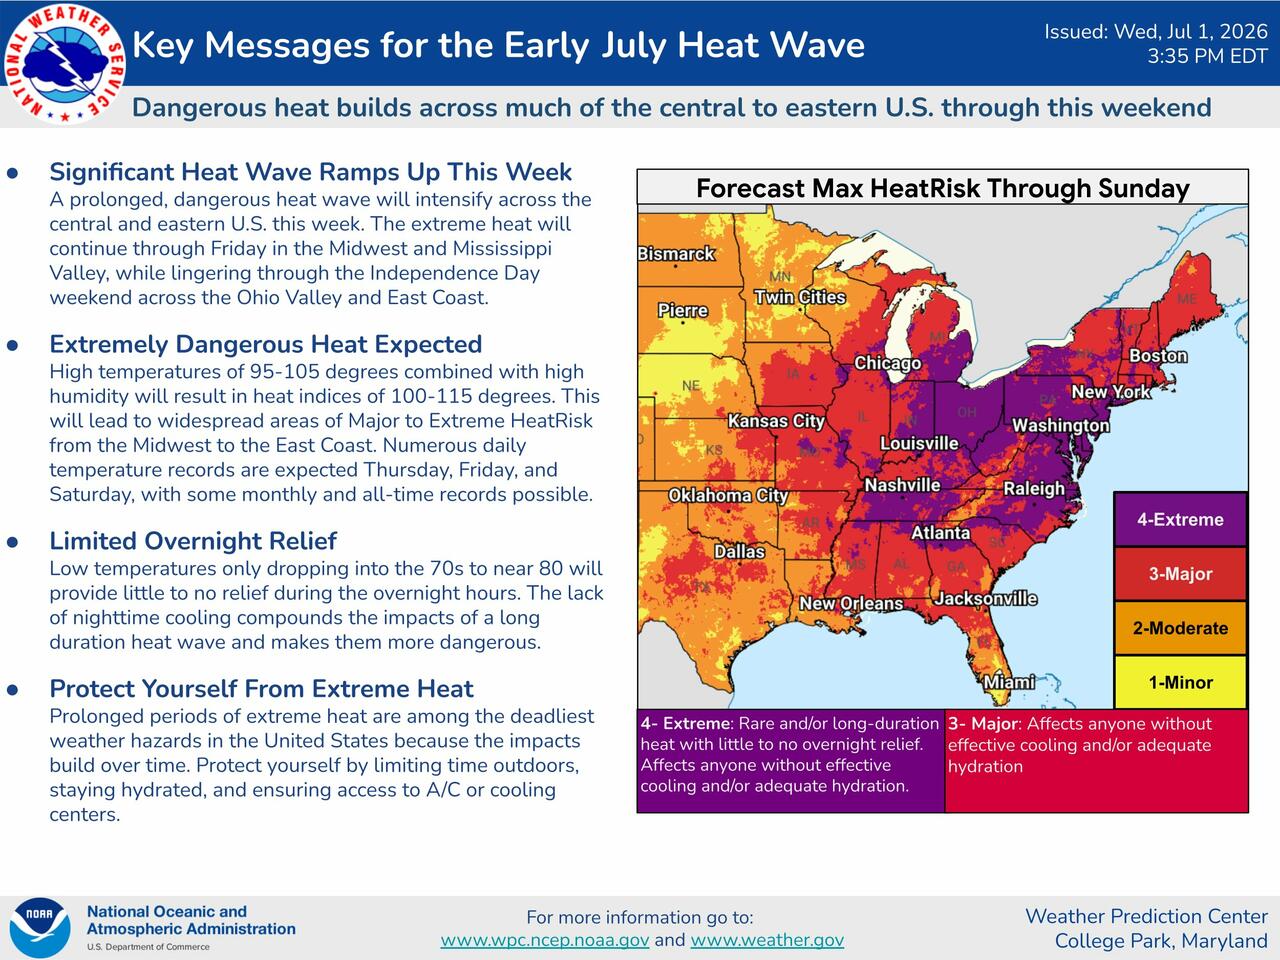
- Power demand across New York is expected to peak today as heat strains the grid ahead of the July 4 weekend. The New York Independent System Operator forecast demand of 32,410 MW, just shy of the record set in July 2013. BBG
- The yen climbed amid speculation of a fresh round of interventions. Japan may shift to surprise tactics to wipe out speculative positions. BBG
- Russian missiles and drones pounded Kyiv and other Ukrainian cities overnight and early Thursday morning, killing at least 17 people and wounding more than 80, according to Ukrainian officials. WSJ
- US nonfarm payrolls probably rose 113,000 in June, with the jobless rate holding steady at 4.3%, consensus shows. Bloomberg Economics predicts a 200,000 gain, helped in part by the World Cup and bolstering expectations for rate hikes this year. BBG
- The US government is in advanced talks with AI companies to create voluntary standards for the release of new models after intervening in the rollout of state of the art tools from Anthropic and OpenAI. FT
- The Trump administration is reportedly ready to launch "Trump Accounts" next week, but not allow firms to host children's savings accounts on their own systems, Semafor reported citing sources.
A more detailed look at global markets courtesy of Newsquawk
APAC stocks were mixed but with the major indices predominantly in the red following the tech-related losses on Wall St, while participants also brace for the incoming Non-Farm Payrolls report in a holiday-shortened trading week stateside. ASX 200 was rangebound as strength in the top-weighted financial sector was offset by losses in the utilities, tech, energy and consumer sectors, while sentiment was also not helped by weak Australian trade data. Nikkei 225 retreated at the open amid tech selling and recent upside in yields, although the index then staged a partial rebound, before selling resumed later in the session. KOSPI slumped amid the pressure in memory chip stocks, and triggered a sidecar in early trade. Hang Seng and Shanghai Comp traded mixed with the mainland conforming to the broad risk-off mood, while the Hong Kong benchmark bucked the trend amid strength in local tech, biopharmaceutical and auto names on return from the holiday closure.
Top Asian News
- Japan's Government Panellist Nagahama said that the BoJ should raise rates once every six months; this would not hurt domestic investment.
European bourses (STOXX 600 +0.5%) initially started Thursday's trade on a softer footing but have climbed off their lows, with all indices in the green, outside of the AEX (-0.3%). Sentiment overnight was on the softer side, following another tech selloff in South Korean stocks (Samsung -9.1%, SK Hynix -14.6%) after Meta plans to sell excess AI compute to build a cloud business, raising questions over excess in AI capacity. However, with Europe lacking the big AI giants, this seems to support the Euro area. European sectors point to a positive bias. Optimised Personal Care (+2.1%) tops the sector pile, followed by Food, Beverages & Tobacco (+2.0%) and Health Care (+1.5%). As expected, Technology (-1.9%) is the clear sector laggard and the only sector in the red.
Top European News
- Germany's ruling coalition unveiled a package of reforms, including EUR 10bln in annual tax relief for lower-income earners, changes to the pension system and building more affordable housing.
- Germany's VDMA reported May industrial orders -1% Y/Y, driven by weak domestic demand and a general decline across the EZ.
FX
- DXY trades lower this morning, and trades at the bottom end of a 100.95 to 101.43 range. Pressure which comes after the lack of hawkish remarks from Fed Chair Warsh at Wednesday's policy panel, and with the move further exacerbated by a hefty move in the JPY this morning.
- On that front, this morning saw large and immediate selling pressure in USD/JPY, where the pair fell from 162.20 to a trough of 161.12. The pair then pared back about a third of that move, stabilising around 161.80, before then taking another beating towards the session low of 160.89 – now trading at levels not seen since 18 June.
- Given the sheer size of the move lower, it does appear to be the case that this is potentially intervention, rather than a rate check. Details of whether they enacted a form of intervention will be released in the monthly release, which is released on the last business day of every month.
- The move comes after Reuters reported that Japan would abandon its habit of warning the markets of intervention. The aim of this is to squeeze speculators and increase the cost of betting against the JPY.
- The potential intervention comes ahead of today’s NFP report; a USD positive report could see some of the “potential intervention” move be pared back. To preview the report in brief, US non-farm payrolls for June are expected to print 110K (prev. 172K), with the unemployment rate seen unchanged at 4.3%.
- Other G10s are stronger against the USD this morning. JPY unsurprisingly outperforms, followed by the GBP and CHF. For the latter, Switzerland reported in-line/cooler-than-expected inflation metrics, which broadly play in favour of keeping rates on hold for the foreseeable future.
Fixed Income
- Global fixed income benchmarks trade on a softer footing ahead of the US payrolls data while Germany announces a new set of reforms.
- USTs (-3 ticks) are lower by a handful of ticks, trading just shy of Wednesday's low of 109-12+. Looking ahead to the June jobs report; NFP expected at 110K (prev. 172K), unemployment to hold steady at 4.3%, average hourly earnings Y/Y expected at 3.5% (prev. 3.4%). In terms of technical levels, downside levels include 109-16 (prior week's low), 108-27 (key support level) and 108-10 (worst low seen due to Iran conflict). 110-00+ is the key level to the upside.
- Bunds (-38 ticks), unlike USTs, have extended on Wednesday's trough, currently trading at the lower end of its 126.78-127.06 range. German Chancellor Merz's coalition unveiled a package of reforms earlier, which included EUR 10bln in annual tax relief for lower-income earners, changes to the pension system and building more affordable housing. The overall aim is to restore competitiveness in Europe's biggest economy. Although the move lower in German debt has not been excessive, it could be a potential reason for the downside in German debt, as it brings growth back into the economy.
- OATs (-34 ticks) follow their German counterpart. In the upcoming months, French debt will be more in focus as the Presidential elections near. Political uncertainty continues to remain. More recently, the Green Party announced that it would put forward a motion of no confidence over the government's handling of the recent heat wave. However, this attempt to bring down PM Lecornuʼs government is likely to fail without the support of other opposition parties. The preference for German debt over OATs is clearly shown in the spread, currently trading at 75bps, up from the 58bps seen at the start of June.
- The UK sells GBP 3.25bln 4.625% 2037 Green Gilt: b/c 3.31x (prev. 3.63x), average yield 4.934% (prev. 4.975%), tail 0.2bps (prev. 0.2bps).
- France sells EUR 14.0bln vs exp. EUR 12.5-14bln 1.25% 2036, 3.70% 2036, 4.50% 2041 and 4.10% 2046 OAT.
- Spain sells EUR 5.958bln vs exp. EUR 5-6bln 2.60% 2031, 3.25% 2034 and 3.40% 2036 Bono and EUR 0.695bln vs exp. EUR 0.25-0.75bln 1.15% 2036 I/L Bono.
- Japan sells JPY 1.96tln 10yr JGBs, b/c 3.13x (prev. 3.53x), average yield 2.729% (prev. 2.649%).
Commodities
- Crude benchmarks are on the backfoot, after mediators suggested positive progress was made in the US-Iran indirect conversation. Conversely, gas benchmarks continue to rise with Dutch TTF above EUR 44/MWh as the European forecast points to renewed heat.
- Brent down to a USD 70.38/bbl base, though it has reverted back towards the USD 71.00/bbl but remains in the red. The mentioned base is the lowest print since the end of February, when USD 70.20/bbl printed for the September contract. ,
- For today, US NFP will dominate the macro narrative, with a full Newsquawk preview available. Specifically for energy, we await any further update from the US-Iran talks, and while the mediator-led exchange has now concluded, we could still see updates as the parties agreed to continue talks over the “coming period”.
- Spot gold at a USD 4080/oz peak. In a recovery from the move below USD 4k/oz seen in the last two sessions. Upside today is a function of a weaker USD and relatively steady UST action. As above, impetus will come from the US NFP report.
- Base peers are under pressure, despite the constructive European risk tone and the mentioned USD pressure. As the complex follows the downbeat performance seen in mainland China overnight, and despite Hong Kong seeing strength on its holiday return.
- US President Trump posted that oil prices are plummeting fast and gas prices at the pump are dropping too, but not as fast as they should be, while he announced the Freedom Fuel Network will be lowering gas prices at 25 “FREEDOM FUEL” stations across the Greater Philadelphia Area.
- Venezuela's oil production was expected to recover to 1.1mln-1.2mln BPD by the end of Q2 2026 as the US expands export authorisations, allowing more companies to transport and market Venezuelan crude
- Saudi Aramco has reportedly increased its exports from the Ras Tanura port and have shifted to spot sales, according to sources.
- Hengli Petrochemical has reportedly cancelled its recent purchases of West African and Middle East oil purchases and also cut refinery operations, according to Reuters sources.
- Dubai spot crude's discount to swaps widened to more than USD 4.00/bbl, the largest gap since May 2020, according to Refinitiv data.
- UBS cuts its end-2026 gold forecast to USD 5k/oz, due to elevated interest rates.
Trade
- China's MOFCOM said China and the EU agreed to up to two annual ministerial trade talks and have invited EU's Trade Commissioner Sefcovic to visit in the Fall.
Geopolitics: Iran
- US official said the US is hopeful that Iran will come to the table to negotiate seriously, but is prepared to walk away if they do not, according to a New York Post reporter on X
- US has informed Iran that changing the status quo around the Strait of Hormuz would be a violation of the current understanding and would be unacceptable, according to Al Arabiya sources.
- Iran said it will respond to US interventions in the Strait of Hormuz, Fars reported.
- Qatar's Foreign Ministry said Qatar and Pakistan mediators concluded separate meetings with US and Iranian negotiators in Doha, while it added that positive progress was made on issues related to the Islamabad MoU. It also stated that the parties agreed to continue discussion over the coming period, with the next meeting to be scheduled at the earliest possible time following the funeral processions of the former Iranian supreme leader.
- Iranian Parliament Speaker Ghalibaf said the claim that inspectors of the IAEA have access to the sites that were bombed is false, while he added that under no circumstances will access be granted to sites that were bombed and damaged.
- Iran's Deputy Foreign Minister Gharibabadi said Doha talks focused on US violations of the MoU and frozen assets. Gharibabadi separately commented that the Strait of Hormuz is defined under Iran's command, not CENTCOM, as well as stated that regional security is ensured by the end of interference and the departure of the US from the region, respect for the sovereignty of countries and acceptance of new geopolitical realities, not under the military umbrella of the US.
- Senior source told Al-Hadath that Iran is allowed to purchase American agricultural products using a portion of its frozen funds, but noted that no cash payments are to be dispersed to Iran
- Lebanon's PM said negotiations with Israel lack a deal framework, and the government seeks a timeline for Israel's withdrawal and insists on exclusive state control of weapons
- Israeli drones struck Al-Dir in southern Lebanon and Israeli shelling was also reported on the outskirts of Quneitra in Syria, while Israeli forces conducted night raids in Jenin and Ramallah, in the West Bank.
Geopolitics: Ukraine
- Russian Armed Forces said it hit a Kyiv plant that produces control systems for specific missiles, RIA reported.
- Russian Defence Ministry said it shot down 327 Ukrainian drones overnight.
- Air defence systems were reportedly repelling a Russian drone attack on Kyiv, while it was separately reported that multiple explosions were heard in Ukraine's capital which was under ballistic missile attack.
- Ukrainian military said it has struck the Kstovo oil refinery in Russia.
Geopolitics: Other
- China warned two Japanese Coast Guard survey vessels to stop conducting maritime surveys in the disputed East China Sea, prompting Japan to lodge a formal diplomatic protest.
US Event Calendar
- 8:30 am: United States Jun Change in Nonfarm Payrolls, est. 112.5k, prior 172k
- 8:30 am: United States Jun Change in Manufact. Payrolls, est. 3k, prior 7k
- 8:30 am: United States Jun Unemployment Rate, est. 4.3%, prior 4.3%
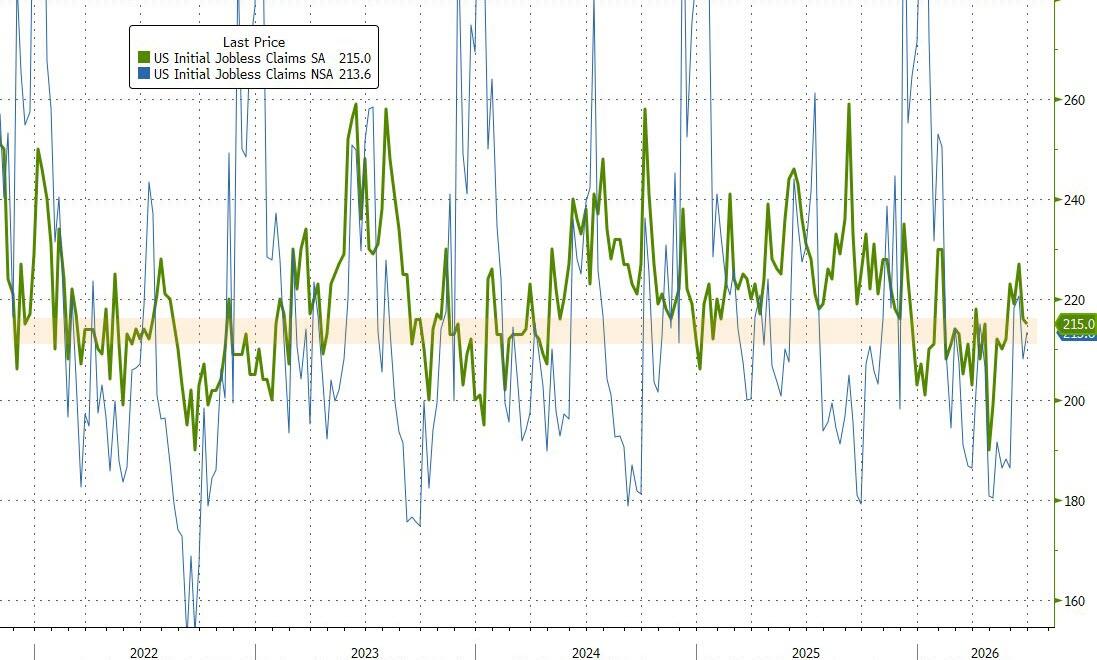
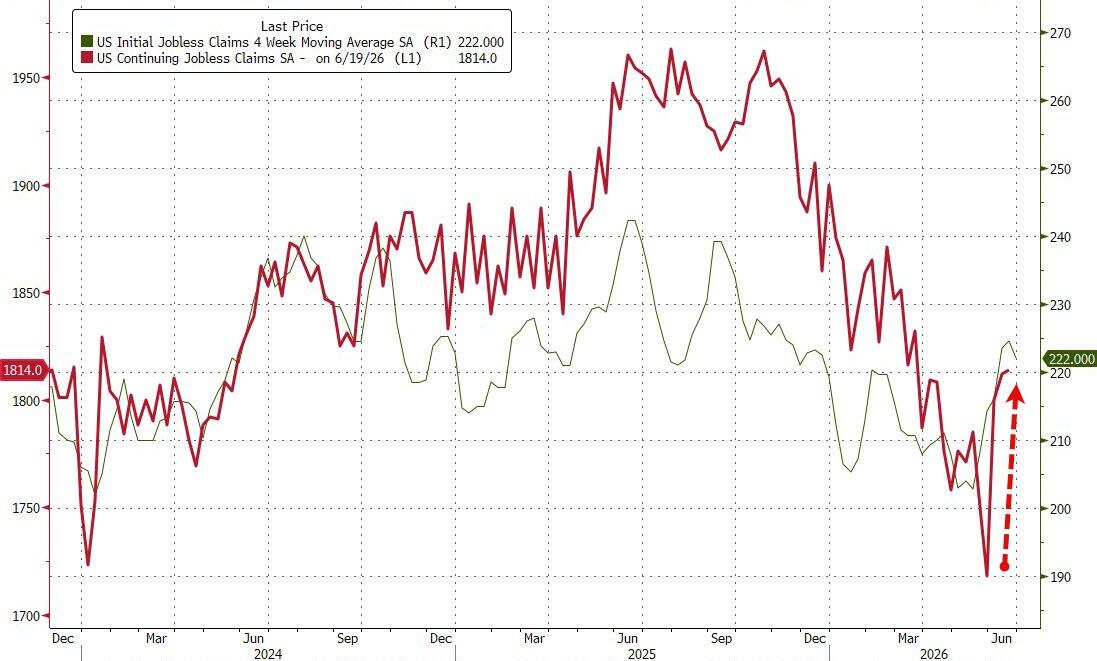
- 8:30 am: United States Jun 27 Initial Jobless Claims, est. 218k, prior 215k
- 8:30 am: United States Jun 20 Continuing Claims, est. 1820k, prior 1821k
- 9:30 am: Canada Jun S&P Global Canada Manufacturing PMI, prior 52.9
- 10:00 am: United States May Factory Orders, est. -2%, prior 4.8%
- 10:00 am: United States May F Durable Goods Orders, est. -4.5%, prior -4.5%
- 10:00 am: United States May F Durables Ex Transportation, est. 1.3%, prior 1.3%
DB's Jim Reid concludes the overnight wrap
Markets have had a rocky start so far to Q3, with global bonds and equities losing ground over the last 24 hours. The main culprit has been another slide in chip stocks, with the Philly semiconductor index down -6.27%. And those losses have continued overnight, with South Korea’s KOSPI down -5.06% this morning. Moreover, an underwhelming batch of US data hasn’t helped matters, with the S&P 500 (-0.22%) and the STOXX 600 (-0.38%) both pulling back as well yesterday.
Yet despite those negative headlines, the performance actually hasn’t been so bad if you look beyond the tech slump. Indeed, the equal-weighted S&P 500 (+0.24%) hit a new record as markets dialled back the chance of an imminent Fed rate hike. In addition, positive geopolitical headlines pushed Brent crude oil (-1.85%) to a 4-month low of $71.57/bbl, and this morning that’s continued, with Brent down another -1.06% to $70.81/bbl. So even as the headline numbers pointed towards fresh losses, there was still a fair amount of optimism among investors.
Those glimmers of positivity have been reflected overnight, where both US and European equity futures have stabilised. For instance, futures on the S&P 500 (+0.09%) and the DAX (+0.27%) are both in positive territory. And even though many indices in Asia have lost ground this morning, they’ve recovered from their lows earlier in the session. Indeed, the Nikkei is down -1.61%, but it had been down -2.55% in the first hour of trading. Similarly, the CSI 300 is down -1.85%, but had been down -2.45% earlier on. And several indices are still higher, including the Hang Seng (+1.19%), and Japan’s TOPIX index (+0.63%).
One of those positive catalysts was headlines from Fed Chair Warsh yesterday, who spoke at the ECB’s Sintra forum. He declined to offer any forward guidance, but markets latched onto his comment that “inflation risks have come down”, even as he reiterated his commitment to price stability. So that meant investors priced out the chance of a July hike, with the futures-implied probability falling from 34% on Tuesday to just 27% by the close. And looking further out, the number of hikes priced by December fell -1.4bps on the day to just 36bps.
That dovish repricing then got further momentum from the latest batch of US data, which was generally a bit softer than expected. For instance, the ADP’s report of private payrolls came in at 98k in June (vs. 120k expected). And shortly after, the ISM manufacturing fell to 53.3 in June (vs. 53.9 expected), with the prices paid component down to a 4-month low of 73.0. So collectively that pushed back against the hawkish narrative and led markets to price out the July hike. Nevertheless, longer-dated Treasury yields still inched higher, with the 10yr yield (+1.4bps) up to 4.48%.
Looking forward, US data will stay in the spotlight today, as the June jobs report is out at 13:30 London time. As a reminder, the last three jobs reports all surprised on the upside, pushing the 3-month average of payrolls to a two-year high of +188k. So that’s been a crucial factor behind the hawkish repricing in recent weeks. For today, our US economists forecast payrolls to come in at +75k, largely reflecting expected payback from strong government and leisure/hospitality hiring last month. Meanwhile, they think the unemployment rate will stay at 4.3%, where it’s been for the last 3 consecutive months.
Over in the Euro Area, yesterday also brought some dovish headlines after the flash CPI print surprised on the downside. It showed headline CPI falling more than expected to +2.8% in June (vs. +3.0% expected), with core CPI also down to +2.4% (vs. +2.5% expected). So that led markets to price in a more dovish path for the ECB over the months ahead, with just 19bps of rate hikes priced in by the December meeting at the close, down -4.3bps on the day. And overnight that’s continued, with just 18bps of hikes now priced in this year. Indeed, with fewer than 25bps now priced by the December meeting, it means investors are pricing in around a one-in-four chance that the ECB might not hike at all again this year.
In the meantime, ECB President Lagarde also spoke on the same panel as Warsh, although her comments didn’t obviously push markets in either direction. She said that the upside inflation and downside growth risks “are probably more broadly balanced than they were a few weeks ago”. But there wasn’t anything that dominated the headlines. So front-end yields fell back in line with the dovish repricing, with the 2yr German yield down -1.6bps. But as in the US, there was a bigger push higher at the long end of the curve, with yields on 10yr bunds (+2.0bps), OATs (+2.9bps) and BTPs (+3.3bps) all rising.
As all that was happening, the dovish momentum got further support from the latest decline in oil prices, with Brent crude (-1.85%) falling to a 4-month low of $71.57/bbl. That followed positive headlines on the US-Iran talks, after Jared Kushner and Steve Witkoff were in Qatar on Tuesday. For instance, Trump said that “They’ve had very good meetings”, and AFP reported yesterday that US and Iranian officials were holding indirect lower-level technical talks with mediators. Ongoing talks were then later confirmed by Vice President Vance, who said that the “negotiators are sitting down with the Iranians, with the Qataris, and with others in Doha, talking about some of the details here”. So the newsflow helped to bring oil prices down and ease investor concern about inflation.
When it came to equities, the dovish momentum was countered by a fresh selloff in chip stocks, which saw the Philly semiconductor index fall -6.27%. So that dragged down US equities more broadly, with the S&P 500 (-0.22%) pulling back after gains on Monday and Tuesday. Nevertheless, there were still broader gains, and the equal-weighted S&P 500 (+0.24%) hit a new record. Moreover, there was a big jump for Meta (+8.81%), which was the third-strongest performer in the S&P 500 yesterday, after Bloomberg reported they were developing plans for a cloud infrastructure business. However, European equities struggled in the meantime, with the STOXX 600 (-0.38%) pulling back as well.
In other news, the US has said they won’t renew the USMCA trade deal but will instead conduct annual reviews. The original deal said that the countries could unanimously agree on a 16-year extension, but US Trade Representative Jamieson Greer said they were “not prepared to rubber stamp the agreement”, and that “there are substantial issues.” The deal is still in place for another decade if no one leaves, but this now begins a 10-year countdown to expiry in 2036 if an agreement isn’t reached.
Looking at the day ahead, data releases include the US jobs report for June, the weekly initial jobless claims, factory orders for May, and the Euro Area unemployment rate for May. Otherwise from central banks, we’ll hear from the Fed’s Daly, the ECB’s Escriva and Cipollone, and the BoE’s Mann.
Tyler Durden
Thu, 07/02/2026 - 08:26


 via Associated Press
 Kawasaki Kaleido
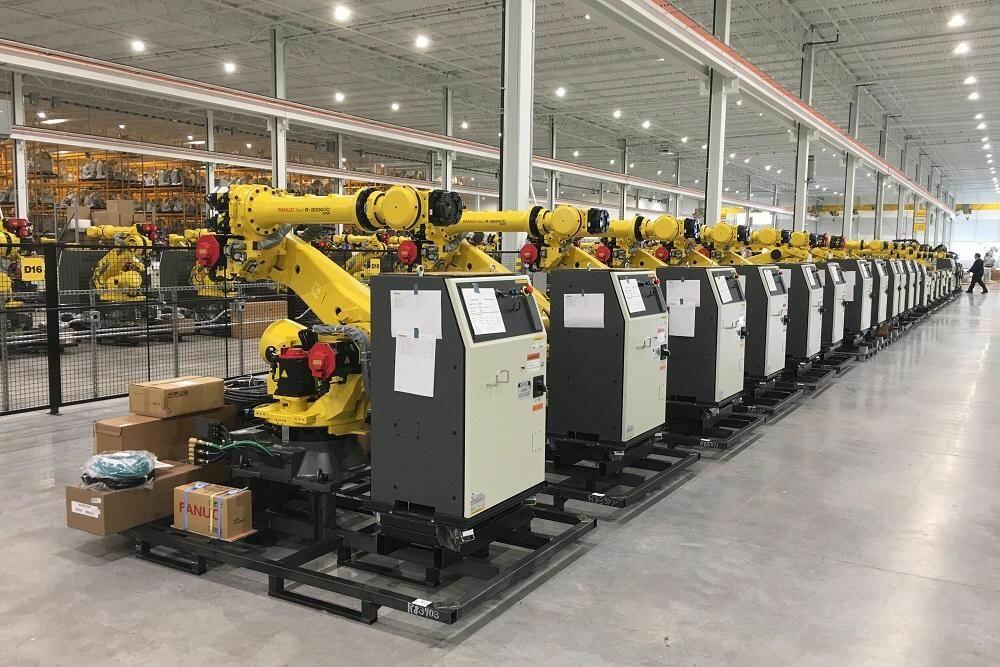 FANUC factory floor
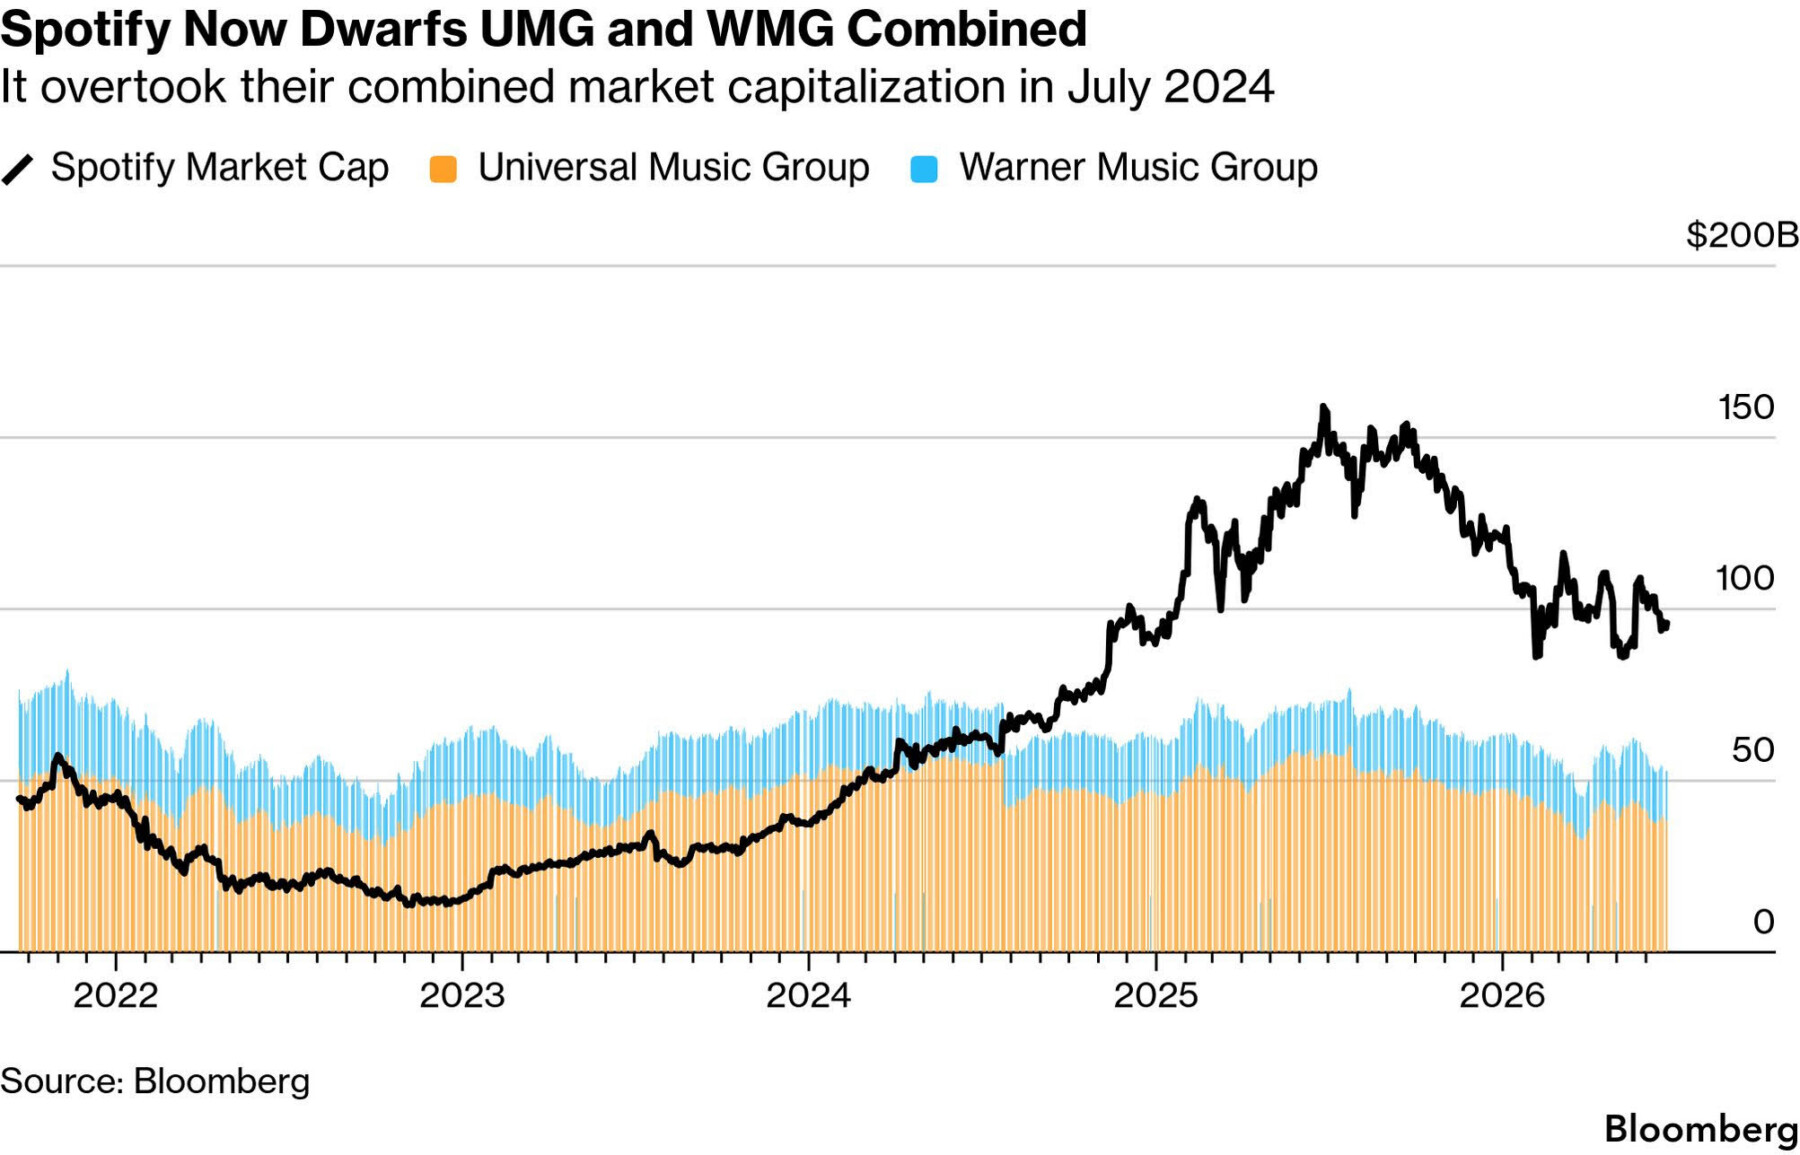


 Getty Images
Recent comments